Top Wall Street analysts like these 3 dividend stocks for high yields

A favorable consumer price index report for April lifted investors’ hopes for rate cuts from the Federal Reserve – and that environment could prove favorable for dividend-paying stocks.

A lower interest rate environment makes dividend payers more compelling to income investors, especially because those stocks would be offering competitive yields versus those of Treasurys.

Recent results reported by several dividend-paying companies have proved their resilience and the ability to pay dividends despite a tough macro backdrop.

Bearing that in mind, here are three attractive dividend stocks, according to Wall Street’s top pros on TipRanks, a platform that ranks analysts based on their past performance.

Ares Capital

The first stock on this week’s list is Ares Capital (ARCC), a company that focuses on financing solutions for small- and middle-market companies. On May 1, the company announced its first-quarter results and declared a quarterly dividend of 48 cents per share, payable on June 28. ARCC stock offers an attractive dividend yield of 9.1%.

Following the results, RBC Capital analyst Kenneth Lee reaffirmed a buy rating on ARCC stock with a price target of $22. While the company’s core earnings per share slightly missed the analyst’s estimate, he noted that first-quarter portfolio activity, including originations, was much greater than his expectations in what is generally observed to be a seasonally slower quarter.

The analyst added that the credit performance in ARCC’s portfolio continues to be strong. While the non-accrual rate increased slightly quarter over quarter, it still remained low at 1.7% of the portfolio compared to the industry average of nearly 3.8%.

“We maintain our Outperform rating, as we favor ARCC’s strong track record of managing risks through the cycle, well-supported dividends, and scale advantages,” said Lee.

Overall, Lee is bullish on ARCC due to its scale and capital position, access to the resources of the broader Ares Credit Group platform, experienced leadership team, and expectations that it can deliver annualized return on equity above peer averages.

Lee ranks No. 40 among more than 8,800 analysts tracked by TipRanks. His ratings have been successful 71% of the time, with each delivering an average return of 17.2%. (See Ares Capital’s Ownership Structure on TipRanks)

Brookfield Infrastructure Partners

Next up is Brookfield Infrastructure (BIP), a leading global infrastructure company that owns and operates diversified, long-life assets in the utilities, transport, midstream and data sectors. The company recently announced its first-quarter results and declared a quarterly distribution of $0.405 per unit.

This quarterly distribution marks a 6% year-over-year increase and is payable on June 28. With an annualized distribution of $1.62 per unit, BIP offers a yield of 5.3%.

Following the Q1 print, BMO Capital analyst Devin Dodge reaffirmed a buy rating on BIP stock, stating that the first-quarter results were largely in line with expectations. However, the analyst lowered his price target to $36 from $40 to reflect the impact of higher interest rates on the stock’s valuation.

Dodge noted that Brookfield’s investment in container-leasing company Triton International is exceeding its underlying assumptions. BIP’s transport business is benefiting from the Triton acquisition as the Red Sea crisis has led to the lengthening of some shipping trade routes and increased global demand for containers.  

Meanwhile, the analyst expects BIP’s capital deployment to be focused on tuck-in opportunities in its existing businesses. He highlighted that the company’s acquisition pipeline also includes large-scale opportunities focused on Asia-Pacific, North America and Europe. The analyst expects new investment activity to pick pace through 2024.

“We believe BIP’s portfolio companies are performing well, the yield is attractive and valuation appears undemanding,” said Dodge.

Dodge ranks No. 582 among more than 8,800 analysts tracked by TipRanks. His ratings have been profitable 68% of the time, with each delivering an average return of 10.6%. (See Brookfield Infrastructure’s Insider Trading Activity on TipRanks)

Realty Income

This week’s final dividend pick is Realty Income (O). It is a real estate investment trust that invests in diversified commercial real estate and has a portfolio of over 15,450 properties in the U.S. and seven countries in Europe.

On May 15, the company paid a monthly dividend of $0.257 per share. Overall, based on the annualized dividend amount of $3.08 per share, the stock’s dividend yield stands at 5.6%.  

In reaction to Realty Income’s first-quarter results, RBC Capital analyst Brad Heffern reiterated a buy rating on Realty Income stock with a price target of $58. The analyst noted that Q1 2024 results slightly exceeded his expectations, marked by an impressive capitalization rate of 8.2% on acquisitions.

Heffern added that the vast majority of the first-quarter acquisitions were in Europe, with the region accounting for 95% of the acquisition volumes. The company attributed the opportunity in Europe to improved confidence in the macroeconomic outlook and motivated sellers. In comparison, higher interest rates and macro uncertainty in the U.S. affected Q1 deal volumes. That said, the company expects the U.S. volumes to pick up in the second half, with a clearer picture of interest rates and the macro outlook.

“We think O has one of the highest-quality net lease portfolios in the space, with an above-average investment grade weighting, a strong industrial portfolio, and a high proportion of tenants with public reporting requirements,” said Heffern.

Heffern ranks No. 505 among more than 8,800 analysts tracked by TipRanks. His ratings have been profitable 48% of the time, with each delivering an average return of 12%. (See Realty Income Stock Buybacks on TipRanks)


Source link

#Top #Wall #Street #analysts #dividend #stocks #high #yields

Walgreens tops quarterly revenue estimates, but narrows profit outlook in ‘challenging’ economy

A person rides past a Walgreens truck, owned by the Walgreens Boots Alliance, Inc., in Manhattan, New York City, U.S., November 26, 2021. 

Andrew Kelly | Reuters

Walgreens on Thursday reported fiscal second-quarter sales that beat Wall Street’s expectations, but lowered the high end of its full-year adjusted earnings outlook in part due to a “challenging” retail environment in the U.S.

The company also posted a steep net loss for the quarter as it recorded a hefty nearly $6 billion charge related to the decline in value of its investment in primary-care provider VillageMD. Walgreens has closed 140 VillageMD clinics amid financial woes for the business, which it sees as critical to its ongoing push to transform from a major drugstore chain into a large health-care company.

But Walgreens does not believe the VillageMD charge “will have a significant impact on our financial position, or our ability to invest across businesses going forward,” Walgreens global CFO Manmohan Mahajan said during an earnings call Thursday.

The results come as Walgreens’ new CEO, Tim Wentworth, works to slash costs and steer the company out of a rough spot with a slate of new executives. Shares of Walgreens fell 30% last year as the company faced weakening demand for Covid products, low pharmacy reimbursement rates, an unsteady push into health care and a challenging macroeconomic environment. 

In a release Thursday, the company said it is confident it will meet its goal of saving $1 billion during fiscal 2024 through its ongoing cost-cutting program. Walgreens has laid off employees, closed unprofitable stores and used artificial intelligence to make its supply chain more efficient, among other efforts.

Here’s what Walgreens reported for the quarter, compared with what Wall Street was expecting, based on a survey of analysts by LSEG, formerly known as Refinitiv:

  • Earnings per share: $1.20 adjusted vs. 82 cents expected
  • Revenue: $37.05 billion vs. $35.86 billion expected

Walgreens narrowed its fiscal 2024 adjusted earnings guidance to between $3.20 and $3.35 per share. That compares with the company’s previous outlook of $3.20 to $3.50 per share. Analysts surveyed by LSEG expect full-year adjusted earnings of $3.24 per share.

Walgreens said the new guidance reflects the hurdles facing retailers in the U.S. and an early wind-down of its sales-leaseback program. It also takes into account lower earnings due to Walgreens’ forward sale of shares of drug distributor Cencora, formerly known as AmerisourceBergen.

The company said a stronger performance in its pharmacy services segment and a lower adjusted effective tax rate helped to offset the factors dragging on its earnings. 

But Mahajan said Walgreens expects the current economic backdrop will “continue to negatively impact our U.S. retail sales in the short term.”

Wentworth noted on the call that the company is “exploring innovative ways to boost profitability and growth” in its retail pharmacy division, such as through new pharmacy reimbursement models.

The company did not give a new revenue forecast for the fiscal year. Walgreens has not provided that guidance since October, when it said it sees $141 billion to $145 billion in sales. 

The company reported a net loss of $5.91 billion, or $6.85 per share, for the quarter. That compares with a net income of $703 million, or 81 cents per share, for the same period a year ago. a

Excluding certain items, including the $5.8 billion non-cash charge related VillageMD, adjusted earnings per share were $1.20 for the quarter.

The company booked sales of $37.05 billion in the quarter, a roughly 6% jump from the same period a year ago. 

Walgreens sees growth across all divisions

The company said that increase reflects sales growth across its three business segments. But Walgreens’ U.S. health-care division stood out as sales jumped about 33% in the fiscal second quarter compared with the same period a year ago. 

Revenue for the segment came in at $2.18 billion.

The company said the higher sales reflect VillageMD’s acquisition of multispecialty care provider Summit Health and growth across all businesses in the segment on a pro-forma basis.

VillageMD sales grew 20% due to same-clinic growth, among other factors. Sales from the segment’s specialty pharmacy company, Shields Health Solutions, grew 13%, due to new contracts and expansions of current partnerships.

Specialty pharmacies are designed to deliver medications with unique handling, storage and distribution requirements, often for patients with complex conditions such as cancer and rheumatoid arthritis.

Walgreens and VillageMD

Source: Walgreens

Meanwhile, Walgreens’ U.S. retail pharmacy segment generated $28.86 billion in sales in the fiscal second quarter, an increase of almost 5% from the same period last year.

That segment operates more than 8,000 drugstores across the U.S., which sell prescription and nonprescription drugs as well as health and wellness, beauty, personal care, and food products. 

Walgreens said pharmacy sales for the quarter rose 8.2% compared with the year-ago quarter. Comparable sales climbed 8.7% due to price inflation in brand medications and “strong execution” in pharmacy services, largely driven by the company’s vaccine portfolio.

Total prescriptions filled in the quarter including immunizations totaled 305.7 million, a more than 2% increase from the same period a year ago. 

Retail sales for the quarter fell 4.5% from the prior-year quarter, and comparable retail sales declined 4.3%. The company pointed to a challenging retail environment and a weaker respiratory season, among other factors. 

Walgreens’ international segment, which operates more than 3,000 retail stores abroad, posted $6.02 billion in sales in the fiscal second quarter. That’s an increase of more than 6% from the year-ago period. 

The company said sales from its U.K. subsidiary, Boots, grew 3%.

When asked on the call about Eli Lilly‘s new direct-to-consumer website aimed at expanding access to its weight loss drug Zepbound, Wentworth did not comment on the program specifically.

But he noted that the company is a “natural partner” for pharmaceutical companies that may “want to go directly to patients for a particular product, where the normal supply chain, reimbursement model, et cetera isn’t working effectively.”

As an example, Wenworth pointed to GLP-1s, a new class of weight loss and diabetes drugs that includes Zepbound. Those drugs must be taken chronically but carry hefty price tags, which can be a hurdle for both patients and insurance plans and other payers.

Walgreens is “uniquely positioned” to distribute drugs and serve as a “clinically aligned partner” that can help patients navigate their treatment safely, according to Wentworth.

Source link

#Walgreens #tops #quarterly #revenue #estimates #narrows #profit #outlook #challenging #economy

Gap shares pop as company’s holiday earnings blow past estimates, Old Navy returns to growth

A general view of an Old Navy store. 

Gap Inc.

Gap’s largest banner Old Navy returned to growth for the first time in more than a year during its holiday quarter as the retailer delivered earnings on Thursday that came in well ahead of Wall Street’s expectations. 

Sales at Old Navy grew 6% to $2.29 billion, and Gap’s overall gross margin surged 5.3 percentage points to 38.9% thanks to fewer markdowns and lower input costs. Analysts had expected a gross margin of 36%, according to StreetAccount. 

Shares of Gap jumped about 5% in extended trading following the report.

Here’s how the retailer did in its fourth fiscal quarter compared with what Wall Street was anticipating, based on a survey of analysts by LSEG, formerly known as Refinitiv:

  • Earnings per share: 49 cents vs. 23 cents expected
  • Revenue: $4.3 billion vs. $4.22 billion expected

The company’s reported net income for the three-month period that ended February 3 was $185 million, or 49 cents per share, compared with a loss of $273 million, or 75 cents per share, a year earlier.

Sales rose slightly to $4.3 billion, up about 1% from $4.24 billion a year earlier. Like other retailers, Gap benefited from a 53rd week during fiscal 2023 and without it, sales would’ve been down during the quarter. The extra week contributed about four percentage points of growth during the fiscal fourth quarter, the company said. 

Comparable sales during the quarter were flat, compared to estimates of down 1.1%, according to StreetAccount. In-store sales were up 4% while online sales decreased 2% and represented 40% of total revenue. 

The retailer decreased inventory by 16% during fiscal year 2023, and with those levels now in check, Gap is working to hold the line on promotions and drive full price selling.

During the quarter, Gap saw higher average selling prices across all of its brands, and it expects to grow its gross margin by at least a half percentage point in fiscal 2024.

“We were the authorities of taking on-trend basics, expressing it in ways that drove cultural conversations. At its best, we were a pop culture brand that did much more than sell clothes and as you know, we all know, we lost our edge. We devolved from a pop culture brand to a clothing retailer, and today we’re moving again,” CEO Richard Dickson told CNBC in an interview.

“We’re getting our vibe back.”

Staging a turnaround

Headed into the holiday season, Gap struck a cautious tone with its outlook as it warned of an “uncertain consumer environment,” and on Thursday, it reiterated those concerns. 

In the current quarter, it expects sales to be roughly flat, compared to estimates of down 0.2%, according to LSEG. For the full year, it expects sales to also be roughly flat, on a 52-week basis, compared to estimates of up 0.5%, according to LSEG. 

“I think we have to look at 2023 where we did see a lot of volatility and uncertainty in the environment. We have inflation, student loan payments, high interest rates, we had dwindling consumer savings. Now fortunately, despite many predictions to the contrary, we didn’t see a recession in the year but our industry was definitely affected,” said Dickson.

“While the apparel market is currently expected to decline in 2024, there are always winners in every market, and we’re seeing the consumer react to newness,” he said. “We’re seeing innovative marketing drive traffic, and it’s inspiring us to believe that we are on the right track with our reinvigoration playbook.”

It’s been a little over six months since Dickson, the former Mattel boss credited with re-igniting the Barbie brand, took over as Gap’s chief executive, and in that time, he’s focused on breathing relevancy back into the retailer’s legacy brands and getting them back to growth. 

Last month, Gap announced it had tapped fashion designer Zac Posen to be its creative director and Old Navy’s chief creative officer. Given its size and contributions to revenue, Gap cannot succeed if Old Navy isn’t winning, and for more than a year, sales have been down even at a time when consumers are hungry for bargains and affordable options. 

Posen, who got his start designing couture gowns and specializes in women’s dresses, is a key hire to Dickson’s executive team. He helps fill in the gaps when it comes to design and apparel, which are areas where Dickson lacks expertise as he’s spent the majority of his career at a toy company. He’ll also play a key role in reigniting cultural relevance across Gap, said Dickson.

“His creative expertise, and his clarity on culture, you know, they’ve consistently evolved American fashion, making him a great fit for the company as we look to energize our culture of creativity and we look to reinvigorate these storied brands,” said Dickson. “His role as chief creative officer at Old Navy is really to harmonize, orchestrate and dial up the storytelling across product and marketing.”

Prior to Posen’s appointment, Dickson hired Eric Chan, the former CFO of the LA Clippers, to be Gap’s chief business and strategy officer. He also hired his former colleague Amy Thompson, Mattel’s former chief people officer, to take on the same role at Gap. 

Banana and Athleta lag

On the back end, Gap has made improvements in growing its gross margin and streamlining its cost structure, but it’s been grappling with a steep decline in sales across its four brands: its eponymous banner, Old Navy, Athleta and Banana Republic. 

Gap and Old Navy have seen some signs of progress but Athleta and Banana Republic have been dragging on the overall business. 

When it comes to Banana, Dickson told CNBC he is “encouraged by the brand’s aesthetic direction” but said it’s going to take time to build back its momentum.

“We gotta get really strong in fixing the fundamentals and strengthening these fundamentals in order to drive more consistent results,” said Dickson. “And that’s what we’re really going to be focused on, our day to day execution, building upon the insights that we’re learning.”

Athleta is still in a state of recovery after numerous leadership shifts and a number of missteps when it came to designing the right type of product in the right styles and colors. It’s also missed the mark in its stores and its marketing, said Dickson.

In August, Athleta named former Alo Yoga President Chris Blakeslee its next CEO, and Dickson said the brand has made strides since he’s come aboard.

“We started the year with a much cleaner palette and we’ve seen early successes in these new arrivals at full price and we’re getting encouraged by the consumer’s reaction,” said Dickson. “I really like where the team is going. We’ve got a new drop strategy, which they’ve been testing, there’s new innovation, color has started to enter the stores and reacted really well.”

Here’s a closer look at each brand’s performance during the fourth quarter:

  • Old Navy: Sales were up 6% to $2.29 billion while comparable sales were up 2%, ahead of estimates of up 1%, according to StreetAccount. 
  • Gap: Sales were down 5% to $1.01 billion, weighed down by selling the brand’s China business, while comparable sales were up 4%, well ahead of estimates of down 1.3%, according to StreetAccount. The brand saw strength in the women’s category. 
  • Banana Republic: Sales were down 2% to $567 million were down 2% while comparable sales were down 4%, better than the 6.7% decline analysts had expected, according to StreetAccount. The company noted that Banana has made progress in “elevating its aesthetic” but re-establishing the brand “will take time and there is work to be done to better execute many of the fundamentals.” 
  • Athleta: Sales were down 4% to $419 million while comparable sales were down a steep 10%. Gap noted that Athleta’s performance improved compared to the prior quarter, but said sales are sluggish as the brand looks to hold the line on pricing and lap a prior period of elevated markdowns. 

Correction: This story has been updated to correct the spelling of fashion designer Zac Posen’s name.

Source link

#Gap #shares #pop #companys #holiday #earnings #blow #estimates #Navy #returns #growth

The Hoax of Modern Finance – Part 11: Valuations, Returns, and Distributions

Note to the reader: This is the eleventh in a series of articles I’m publishing here taken from my book, “Investing with the Trend.” Hopefully, you will find this content useful. Market myths are generally perpetuated by repetition, misleading symbolic connections, and the complete ignorance of facts. The world of finance is full of such tendencies, and here, you’ll see some examples. Please keep in mind that not all of these examples are totally misleading — they are sometimes valid — but have too many holes in them to be worthwhile as investment concepts. And not all are directly related to investing and finance. Enjoy! – Greg


Market Valuations

Because secular markets are defined by long-term swings in valuations, let’s look at the Price Earnings (PE) ratio and study its history. Robert Shiller created a valuable measure of PE valuation that uses trailing (actual) earnings, averaged over a 10-year period. Here’s how it is calculated:

  • Use the yearly earning of the S&P 500 for each of the past 10 years.
  • Adjust these earnings for inflation, using the CPI (i.e. quote each earnings figure in current dollars).
  • Average these values (i.e., add them up and divide by 10), giving us e10.
  • Take the current Price of the S&P 500 and divide by e10.

Figure 8.1 shows the S&P Composite on a monthly basis adjusted for inflation, back to 1871, with a regression line so you can get a feel (visually) of where the current price is relative to the long-term trend of prices. The lower plot is the Shiller PE10 plot, with peaks and troughs identified with their values. You can see that all prior secular bears ended with PE10 as a single digit (4.8, 5.6, 9.1, and 6.6). The PE10, on March 9, 2009, only got down to 13.3, which is considerably higher than the level reached by all prior secular bear lows. Based on this simple analogy, I think we have yet to see the secular bear low for this cycle. Remember, it does not mean that the prices have to go lower than they did in 2009; it just means the PE10 should drop to single digits. Remember, PE is a ratio of Price over Earnings. To make the ratio smaller, either the price can decline, the earnings can increase, or a combination of both.

As of December 31, 2012, the PE10 is at 21.3. Referencing the small box in the lower left corner shows that this value is in the fifth quintile of all the PE data. Based on this analysis, the market is overvalued.

So when the financial news noise is constantly parading analysts by touting the PE as overvalued or undervalued, you can count on the fact that they are using the forward PE ratio. The forward ratio is the guess of all the earnings analysts. They are rarely correct. Ignore them.

Finally, Figure 8.2 shows the PE10 in 10 percent increments or deciles. It shows the extreme level reached in the late 1990s from the tech bubble, it shows the 1929 peak, and it shows that, as of December 31, 2012, we are at the 82nd percentile of PE10. This puts the PE10 overvalued on a relative basis, and also on an absolute basis, as shown in Figure 8.1. Remember, PE10 used real reported (trailing) earnings, not forward (guess) earnings. As Doug Short says on his website at dshort.com: A more cautionary observation is that when the PE10 has fallen from the top to the second quintile, it has eventually declined to the first quintile and bottomed in single digits. Based on the latest 10-year earnings average, to reach a PE10 in the high single digits would require an S&P 500 price decline below 540. Of course, a happier alternative would be for corporate earnings to continue their strong and prolonged surge. If the 2009 trough was not a PE10 bottom, when would we see it occur? These secular declines have ranged in length from more than 19 years to as few as three. As of December 31, 2012, the decline in valuations was approaching its 13th year.

Secular Bear Valuation

Figure 8.3 shows the Shiller PE10 monthly for all the past secular bear markets since 1900, with the current secular bear (as of 2013) in bold. What is really interesting about this chart is that most of the secular bears began with PE Ratios in the 20 to 30 range and ended with them in the 5 to 10 range. The current secular bear began with a PE in the mid-40s and is now only back down to the level that the previous secular bears began. That could imply that the secular bear that began in 2000 could be a long one. These charts were created using monthly data; if yearly data were used, the concept would be even more pronounced.

Secular Bear Valuation Composite

In Figure 8.4, the current secular bear market valuation is shown in bold, with the other line representing the average of the previous four secular bears. Again, this type of analysis is just an observation and for educational purposes; you cannot make investment decisions from this. Investment decisions come from actionable information and analysis.

Secular Bull Valuation

Figure 8.5 of secular bull market valuations shows that most of them begin with PE ratios in the 5 to 10 (same as where secular bears end) and they end with PE ratios in the 20 to 30 range. The excessive secular bull of 1982 to 2000 reached unbelievable high valuations. I remember everyone saying that this time was different. Wrong!

Secular Bull Valuation Composite

 The secular bull market valuation composite is shown in Figure 8.6. It is the average of all the secular bull markets since 1900. Since we are currently in a secular bear market, the average of the secular bull markets is shown by itself.

Market Sectors

I use the sector definitions provided by Standard & Poor’s, of which there are 10. The other primary source for sector analysis is Dow Jones. Either is fine, I just prefer the S&P structure because I have been using it for so long. Table 8.1 shows the 10 sectors’ annual price performance since 1990, and Table 8.2 shows the relative performance of the total returns. When viewing a table of relative returns as in Table 8.2, keep in mind that each column (year) is completely independent of the preceding year or following year. Also, the relative ranking shows that those in the top part of the column outperformed those in the lower part of the column, independent of whether the returns were positive, negative, or a combination. Another value of this type of table is to show that picking last year’s top performer is not a good strategy. Remember, you cannot retire on relative returns.

This book does not get into the various uses of sectors as investments, but the book would not be complete without the mention of sector rotation and, in particular, how various sectors rotate in and out of favor based on the phase of the business cycle and the economy. A further delineation of sectors is their propensity to fall within the broad categories of offensive and defensive. This means that when the market is performing poorly, the defensive sectors will generally outperform, and when the market is performing well, it is the offensive sectors that are the top performers.

The phases of the economy known as economic expansions and contractions are affected by many events but generally boil down to recessions and periods of expansion. It should be noted, however, that not all contractions end up being recessions. The phases can then be broken down into early cycle, mid-cycle, and late cycle segments of the full cycle. There is a lot of literature available to cover all these details, but the point of this discussion is to show the rotational movement of the various sectors through the economic cycle.

Figure 8.7 is a graphic showing the sectors and where they fall in the cycle. It shows the rotation of sectors during an average economic cycle for the past 67 years and is courtesy of Sam Stovall, chief equity strategist, S&P Capital IQ. Sam wrote one of the best books on sector rotation years ago, Standard & Poor’s Sector Investing: How to Buy the Right Stock in the Right Industry at The Right Time, but is currently out of print as of 2013.

Another excellent study I have seen on the cycles within the phases and what sectors are affected was put out by Fidelity and dated August 23, 2010 (see Table 8.3). It clearly showed that, from 1963 through 2010, the following sectors were strongest during the various phases. In each cycle, the top-performing sectors are shown, with the first being the best of the four and the last being the worst of the top four, which is still the fourth best out of the 10 sectors.

It was interesting to note in this study that during all of the three cycles, Utilities and Healthcare were the two worst-performing of all 10 of the sectors (not shown). They only ranked in the top four during actual recessions. Since recessions are usually identified by the NBER about a year after they begin and sometime not until they have ended, this is not knowledge that you can make investment decisions with.

However, you can use a momentum analysis and always be in the top four sectors and probably do well. Clearly, this is certainly better than buy-and-hold or index investing.

Figure 8.8 shows the S&P 500 in the top plot and my Offensive-Defensive Measure in the lower plot. The concept of the Offensive-Defensive Measure is simple.

The Offensive Components

  • Consumer Discretionary
  • Financials
  • Industrials
  • Information Technology

The Defensive Components

  • Consumer Staples
  • Utilities
  • Healthcare
  • Telecom

You can see that the rally from the left side of the chart to point A (February, 2011) was strong; however, based on the switch from offensive to defensive sectors that occurred at point A, the investors were clearly concerned about the market. While the market traded sideways for months (see top plot), the defensive sectors were clearly in the lead, causing the offense-defense measure to decline. The measure declined significantly, and it wasn’t until point B (July 2011) that the market finally gave up and headed south.

Sector Rotation in 3D

Julius de Kempenaer has created a novel way of visualizing sector-rotation, or, more generally, “market-rotation,” in such a way that the relative position of all elements in a universe (sectors, asset classes, individual equities, etc.) can be analyzed in one single graph instead of having to browse through all possible combinations. This graphical representation is called a Relative Rotation Graph or RRG. As of 2013, Julius is now working together with Trevor Neil to further research and implement the use of RRGs in the investment process of investment companies, funds, and individual investors. More information can be found on their website www.relativerotationgraphs.com.

A Relative Rotation Graph takes two inputs that together combine into an RRG. I’ll use the S&P Sectors for this discussion. The first step is to come up with a measure of relative strength of a sector versus the S&P 500; this is done by taking a ratio between each sector and the S&P 500. Analyzing the slope and pace of these individual RS lines gives a pretty good clue about individual comparisons versus their benchmark. These raw RS lines answer “good” or “bad.” However, they do not answer “how good” or “how bad” or “best” and “worst.” The reason for this is that Raw RS values (sector/benchmark) for the various elements in the universe are like apples and oranges, as they cannot be compared based on their numerical value.

Taking the relative positions of all elements in a universe into account in a uniform way enables “ranking.” This process normalizes the various ratios in such a way that their values can be compared as apples to apples, not only against the benchmark but also against each other. The resulting numerical value is known as the JdK RS-Ratio—the higher the value, the better the relative strength. Additionally, not only the level of the ratio, but also the direction and the pace at which it is moving, affects the outcome. A concept similar to the well-known MACD indicator is used to measure the Rate of Change or Momentum of the JdK RS-Ratio line. Here also, it is important to maintain comparable values so another normalization algorithm is applied to the ROC; this line is known as the JdK RS-Momentum. The RRG now has JdK RS-Ratio for the abscissa (X axis) and the JdK RS-Momentum for the ordinate (Y axis). Graphically, the rotation looks like Figure 8.9.

In Figure 8.10, the sectors that are showing strong relative strength, which is still being pushed higher by strong momentum, will show up in the top-right quadrant. By default, the Rate of Change will start to flatten first, then begin to move down. When that happens, the sector moves into the bottom-right quadrant. Here, we find the sectors that are still showing positive relative strength, but with declining momentum. If this deterioration continues, the sector will move into the bottom-left quadrant. These are the sectors with negative relative strength, which is being pushed farther down by negative momentum. Once again, by default, the JdK RS-Momentum value will start to move up first, which will push the sector into the top-left quadrant. This where relative strength is still weak (i.e. < 100 on the JdK RS-Ratio axis) but its momentum is moving up. Finally, if the strength persists, the sector will be pushed into the top-right quadrant again, completing a full rotation.

The next step is to add the third dimension, time, to the plot to visualize the data on a periodic basis and in fact, somewhat like watching a flip chart or animation in which you can see the movement of each of the sectors around the chart as shown in Figure 8.10.

This technology, in static form, is available on the Bloomberg professional service since January 2011 as a native function (RRG<GO>) where users can set their desired universes, benchmarks, lookback periods, and so on. On their aforementioned website, Julius and Trevor maintain a number of RRGs, static and dynamic (animated rotation), on popular universes like the S&P 500 sectors (GICS I & II). Several professional as well as retail software vendors and websites are working to embed the RRG technology in their products, which should make this unique visualization tool available to a wider audience.

Asset Classes

Asset classes can be analyzed exactly the same as market sectors. The only limitation is that they are not tied as closely to economic cycles as sectors, so it is more difficult to identify those that are offensive or defensive. Table 8.4 shows the price performance of a multitude of asset classes. Remember, this table is only showing the annual performance of each asset for each year since 1990, while Table 8.5 has the asset classes ranked each year numerically. Normally, this type of table is shown with multiple colors, but somewhat difficult in a black-and-white book, so rankings are shown. Again, remember that the rankings only show the relative performance, and each year is totally independent of the preceding or following year.

The Lost Decade

Figure 8.11 shows the S&P 500 Total Return from December 31, 1998, to December 31, 2008. Two huge bear markets and two good bull markets. If you have a strategy that could capture a good portion of those bull markets and avoid a good portion of those bear markets, you would do really well. Buy and hold has lost money over this period.

I get asked all the time, “Are we going to have another bear market?” I answer that I can guarantee you that we will; I just have no idea when it will be. However, we can turn to another group of very bright people from the third-largest economy in the world (as of 2013) and look at their market. Figure 8.12 is the Japanese Nikkei from December 31, 1985, to December 31, 2011, a period of time of 26 years, over a quarter of a century.

Clearly, buy and hold was a devastating investment strategy, and the really bad news is that it still is. Figure 8.13 shows the up and down moves during this period, in which a good trend following strategy could have protected you from horrible devastation.

The percentage moves up are shown above the plot, and the percentage moves down are below the plot. These are the percentage moves for each of the up and downs you see on the chart. There were five cyclical bull moves of greater than 60 percent during this period. There were also five cyclical bear moves of greater than -40 percent. Remember, a 40 percent loss requires a gain of 66 percent just to get back to even. The small box in the lower right edge shows the decline from the market top in late December 1989 (–73.3 percent). A 73 percent decline requires a gain of 285 percent to get back even. Most people won’t live long enough for that to happen.

Finally, please notice that Figure 8.13 covers approximately 30 years of data and that the point on the right end (most recent value) is approximately equal to the starting point back in the mid-1980s; certainly the lost three decades. Buy and Hold is Buy and Hope.

Market Returns

It is always good to see how the markets have performed in the past. With the advent of the internet, globalization, minute-by-minute news, investors have a natural tendency to focus on the short term. Without a knowledge of the long-term performance of the markets, that short-term orientation can cause one to be totally out of touch with the reality that the market does not always go up. The following charts will show annualized returns for the S&P 500 price, total return, and inflation-adjusted total return over various periods. These types of charts are also known as rolling return charts. As an example, using the 10-year annualized rolling return, the data begins in 1928, so the first data point would not be until 1938 and be the 10-year annualized return from 1928 to 1938. The next data point would be for the 10-year period from 1929 to 1939, the third from 1930 to 1940, and so on.

Figure 8.14 shows the 1-year annualized return for the S&P price. It should be obvious that one-year returns are all over the place, oscillating between highs in the 40 percent to 50 percent range, and lows in the -15 percent to -25 percent range. Following Figure 8.14 are the 3-year (Figure 8.15), 5-year (Figure 8.16), 10-year (Figure 8.17), and 20-year (Figure 8.18) charts of annualized returns, with the average for all the data shown in the chart caption. Following the 20-year chart is a further analysis for the 20-year period.

The 10-year return chart now clearly shows up-and-down trends in the data (see Figure 8.17).

The 20-year rolling return chart (Figure 8.18) continues to reduce the short-term volatility in the chart, and the up-and-down trends become clear.

Since I adamantly believe that most investors have about 20 years to really put money away in a serious manner for retirement, the following two charts show returns over 20 years for total return (Figure 8.19) and inflation-adjusted total return (Figure 8.20).

For most analysis, the Price chart is more than adequate. In the world of finance, there is an almost universal demand for the Total Return chart; however, I think that if you are going to insist on Total Return, you should then also insist on Inflation-Adjusted Total Return. Using the three preceding 20-year charts and the averages shown, you can see that the average for Price is 6.97 percent, Total Return is 11.32 percent, and Inflation-Adjusted Total Return is 7.19 percent. What this says is that the effect of including dividends (Total Return) and the effect of Inflation often neutralize each other.

Table 8.6 shows the annualized returns for the S&P 500 for price, total return, and inflation-adjusted total return for the following periods: 1-year, 2-year, 3-year, 5-year, 10-year, and 20-year.

Table 8.7 shows the minimum and maximum returns, along with the range of returns, their mean, median, and variability about their mean (Standard Deviation).

Distribution of Returns

The range of return data is very easy to calculate because it is simply the difference between the largest and the smallest values in a data set. Thus, range, including any outliers, is the actual spread of data. Range equals the difference between highest and lowest observed values. However, a great deal of information is ignored when computing the range, because only the largest and smallest data values are considered. The range value of a data set is greatly influenced by the presence of just one unusually large or small value (outlier). The disadvantage of using range is that it does not measure the spread of most of the values—it only measures the spread between highest and lowest values. As a result, other measures are required in order to give a better picture of the data spread. The monthly returns for the S&P 500 begin with December 1927, so, as of December 2012, there are 1,020 months (85 years) of data.

Additional charts show the distribution of data in various ways using the 20-year annualized returns of the S&P 500 inflation-adjusted total return data for rolling 20-year periods. Twenty-year returns from the S&P 500 with 1,020 months of data would yield 778 data points. Return distributions can be thought of like this: Each bar represents the proportion of the returns that meet a percentage division of the data, mathematical division of the data, or statistical division of the data. The following are definitions of the various distribution methods, as shown in the title of the following figures.

  • Decile. One of 10 groups containing an equal number of the items that make up a frequency distribution. The range of returns is determined by the difference between the minimum and maximum returns in the series, then divided by 10 to create 10 equal groups.
  • Quartile. The calculation is similar to decile (above), but with only four groupings.

(Note: This use of decile and quartile does not follow the standard definition or calculation method often used in statistics.)

  • Standard deviation. A statistical measure of the amount by which a set of values differs from the arithmetical mean, equal to the square root of the mean of the differences’ squares. Figure 8.21 shows the percentage of the data that is included in a standard deviation. You can see that the mean is the peak and that 68.2 percent of the data is within one standard deviation from the mean, and 95.4 percent of the data is within two standard deviations of the mean.
  • Percentage. A proportion stated in terms of one-hundredths that is calculated by multiplying a fraction by 100.

Figure 8.22 shows the 20-year rolling returns using inflation-adjusted total return data distributed by quartiles. From the chart, you can see that 13.24 percent of the returns fall into the first quartile, or lowest 25 percent, of the data, 28.15 percent in the second, 32.90 percent in the third, and 25.71 percent in the fourth quartile or highest 25 percent of the data.

Figure 8.23 shows the same data, but in a decile distribution where each bar represents 10 percent of the number of data items. For example, 8.23 percent of the data fell in the highest 10 percent of the data.

Figure 8.24 shows the distribution of the data based on variance from the mean or standard deviation. You can see that the two middle bars each represent 34.1 percent of the data (68.2 percent total) that is one standard deviation from the mean. As an example, 33.68 percent of the 20-year rolling returns data was within one standard deviation above the mean of all the data. You can also surmise that the two bars on the right represent 50 percent of all the data and 53.86 percent (33.68 + 20.18) of the returns. Oversimplifying this, one then knows that there were more returns greater than the mean. However, there is an asymmetrical distribution between the returns that are outside of one standard deviation from the mean, with the larger percentage to the downside.

Figure 8.25 shows the 20-year rolling returns of the S&P 500 inflation-adjusted total return within percentage ranges. The bar on the left shows all the returns of less than 8 percent, which accounted for more than 50 percent of all returns (51.41 percent), while the bar on the right shows returns of greater than 12 percent, accounted for only 11.31 percent of all returns. The bar in the middle is the range of returns between 8 percent and 12 percent, which accounted for 37.28 percent of all returns. Recall the discussion in Chapter 4 on the deception of average, and once again the average 8 percent to 12 percent return is not average.

When the market starts to decline significantly, it is not the same as when someone yells “fire” in a theater. In a theater, everyone is running for the exits. In a big decline in the market, you can run for the exits, but first you have to find someone to replace you—you must find a buyer. Big difference! This chapter has attempted to stick to what I believe are market facts and essential information you should understand in regard to how markets work and have worked in the past. If one does not know market history, it would be very difficult to keep a focus on what the possibilities are in the future.

This concludes the first section of this book, where I have attempted to show you the many popular beliefs about the market that are used by academia and Wall Street to help sell their products. Part I also wraps up with what I believe to be truisms about the market. Part II has an introductory chapter on technical analysis and is followed by two chapters on extensive research into trend determination and risk/drawdowns.


Thanks for reading this far. I intend to publish one article in this series every week. Can’t wait? The book is for sale here.

Source link

#Hoax #Modern #Finance #Part #Valuations #Returns #Distributions

Best Buy warns of layoffs as it issues soft full-year guidance

People walk past a Best Buy store in Manhattan, New York City, November 22, 2021.

Andrew Kelly | Reuters

Best Buy surpassed Wall Street’s revenue and earnings expectations for the holiday quarter on Thursday, even as the company navigated through a period of tepid consumer electronics demand.

But the retailer warned of another year of softer sales and said it would lay off workers and cut other costs across the business. CEO Corie Barry offered few specifics, but said the company has to make sure its workforce and stores match customers’ changing shopping habits. Cuts will free up capital to invest back into the business and in newer areas, such as artificial intelligence, she added.

“This is giving us some of that space to be able to reinvest into our future and make sure we feel like we are really well positioned for the industry to start to rebound,” she said on a call with reporters.

For this fiscal year, Best Buy anticipates revenue will range from $41.3 billion to $42.6 billion. That would mark a drop from the most recently ended fiscal year, when full-year revenue totaled $43.45 billion. It said comparable sales will range from flat to a 3% decline.

The retailer plans to close 10 to 15 stores this year after shuttering 24 in the past fiscal year.

One challenge that will affect sales in the year ahead: it is a week shorter. Best Buy said the extra week in the past fiscal year lifted revenue by about $735 million and boosted diluted earnings per share by about 30 cents.

Shares of Best Buy closed more than 1% higher Thursday after briefly touching a 52-week high of $86.11 earlier in the session.

Here’s what the consumer electronics retailer reported for its fiscal fourth quarter of 2024 compared with what Wall Street was expecting, based on a survey of analysts by LSEG, formerly known as Refinitiv:

  • Earnings per share: $2.72, adjusted vs. $2.52 expected
  • Revenue: $14.65 billion vs. $14.56 billion expected

A dip in demand, but a better-than-feared holiday

Best Buy has dealt with slower demand in part due to the strength of its sales during the pandemic. Like home improvement companies, Best Buy saw outsized spending as shoppers were stuck at home. Plus, many items that the retailer sells like laptops, refrigerators and home theater systems tend to be pricier and less frequent purchases.

The retailer has cited other challenges, too: Shoppers have been choosier about making big purchases while dealing with inflation-driven higher prices of food and more. Plus, they’ve returned to splitting their dollars between services and goods after pandemic years of little activity.

Even so, Best Buy put up a holiday quarter that was better than feared. In the three-month period that ended Feb. 3, the company’s net income fell by 7% to $460 million, or $2.12 per share, from $495 million, or $2.23 per share in the year-ago period. Revenue dropped from $14.74 billion a year earlier.

Comparable sales, a metric that includes sales online and at stores open at least 14 months, declined 4.8% during the quarter as shoppers bought fewer appliances, mobile phones, tablets and home theater setups than the year-ago period. Gaming, on the other hand, was a strong sales category in the holiday quarter.

In the U.S., Best Buy’s comparable sales dropped 5.1% and its online sales decreased by 4.8%.

During the quarter, traditional holiday shopping days were Best Buy’s strongest, CFO Matt Bilunas said on the company’s earnings call. Comparable sales were down 5% year over year in November but fell just 2% in December around the gift-giving holidays. January was the weakest month during the quarter with comparable sales down 12%, he said.

Barry said customers “were very deal-focused through the holiday season.” Sales on days known for deep discounts like Black Friday and the week of Cyber Monday matched expectations, but the December sales lull was worse than expected.

Demand was stronger than the company anticipated in the four days before Christmas.

Signs of ‘stabilization’

On the earnings call, Barry said Best Buy expects the coming year to be one “of increasing industry sales stabilization.”

She said the company is “focused on sharpening our customer experiences and industry positioning,” along with driving up its operating income rate. That metric is expected to improve in the coming year.

Strength in services revenue, which includes fees from its annual membership program, in-home installation and repairs, has helped to offset weaker demand for new items. It’s a growth area that the company expects will persist in the coming year.

Some gains in its service business came from a switch to My Best Buy, a three-tiered membership program that ranges in price from free to $179.99 per year depending on the perks and benefits.

The company removed home installations as a perk of that program, which Barry said on a call with reporters resulted in more people choosing to pay for that service.

As of the end of the fiscal year, My Best Buy had 7 million paid members. She said customers who belong to the program spent more at Best Buy than those who don’t.

Barry said Best Buy’s services will help the retailer stand out, especially as customers seek guidance as artificial intelligence becomes part of more devices.

The retailer has been waiting for customers to upgrade and replace their consumer electronics after the pandemic-induced wave. There are some signs that cycle has begun, Barry said on the earnings call. For example, she said, year-over-year comparable sales for laptops turned positive in the fiscal fourth quarter and have remained positive in the first quarter.

She cited other positive indicators, too, including cooling inflation and “green shoots” in the housing market. Sales at Best Buy are not directly correlated to the housing market, which has seen slower turnover, but home purchases do tend to spur appliance and TV purchases, she said.

Best Buy paid dividends of $198 million and spent $70 million on share buybacks during the period. On Thursday, the company said its board of directors had approved a 2% increase in the regular quarterly dividend to 94 cents per share, which will be paid in April.

As of Thursday’s close, Best Buy’s stock is up roughly 3% so far this year. The company has underperformed the approximately 7% gains of the S&P 500 during that period. Best Buy has a market value of about $17.4 billion.

Don’t miss these stories from CNBC PRO:

Source link

#Buy #warns #layoffs #issues #soft #fullyear #guidance

Walmart beats Wall Street’s holiday expectations as e-commerce sales soar

Walmart said Tuesday that quarterly revenue rose 6%, as shoppers turned to the big-box retailer throughout the holiday season and the company’s global e-commerce sales grew by double digits. 

The retail giant also announced Tuesday that it would acquire smart TV maker Vizio to accelerate growth of its advertising business. Walmart is acquiring the company for $2.3 billion, or $11.50 per share. 

In a CNBC interview, Chief Financial Officer John David Rainey said customers have still shown discretion with purchases. They are putting fewer items in their baskets but shopping more frequently, he said. Electronics, TVs, computers and some other expensive items have been a tougher sell, Rainey added.

Yet, he said even after the holiday rush, Walmart saw continued sales strength.

Here’s what Walmart reported compared with what Wall Street was expecting, based on a survey of analysts by LSEG, formerly known as Refinitiv:

  • Earnings per share: $1.80 adjusted vs. $1.65 expected
  • Revenue: $173.39 billion vs. $170.71 billion expected

In the three-month period that ended Jan. 31, Walmart’s net income fell to $5.49 billion or $2.03 per share, compared with $6.28 billion, or $2.32 per share, in the year-ago period.

Revenue increased from $164.05 billion in the year-ago period.

Walmart said it expects consolidated net sales to rise 4% to 5% in its fiscal first quarter. It also anticipates adjusted earnings of $1.48 to $1.56 per share on a pre-stock split basis.

For its fiscal 2025, the retailer expects consolidated net sales will climb 3% to 4%. Walmart anticipates adjusted earnings will be $6.70 to $7.12 per share on a pre-stock split basis.

Walmart shares closed 3% higher Tuesday after the company shared its results, outlook and acquisition news. Shares of Walmart are up more than 11% this year, outperforming the S&P 500, which is up about 4% during the same period.

Walmart’s e-commerce strength

Walmart has weathered high inflation better than many other retailers. It has used its value reputation to draw in families across income levels and has leaned into new ways to make money, such as selling ads, expanding its third-party marketplace and offering a subscription-based program called Walmart+.

Comparable sales, an industry metric also known as same-store sales, rose 4% for Walmart U.S. At Sam’s Club, comparable sales increased 1.9%, including fuel. 

Global e-commerce sales jumped 23% year over year, topping $100 billion in total. In the U.S., e-commerce rose 17% as shoppers used curbside pickup and got orders delivered to their homes.

Customer transactions increased 4.3% compared with the year-ago period in the U.S. However, average ticket, or the amount that a customer spent, declined slightly. 

Prices have fallen in some categories. Private brands made by Walmart, which tend to be cheaper, have gained popularity in the U.S. and other parts of the world.

CEO Doug McMillon said on an earnings call Tuesday that prices of general merchandise, a category that includes items such as clothing, are lower than a year ago and even two years ago for some things. For food, prices are lower for some items such as apples, eggs and deli snacks, but higher for other items such as asparagus and blackberries.

Prices of dry grocery items, paper goods and cleaning supplies are up mid-single-digit percentages compared to last year and high teens compared with two years ago.

Walmart also backed away from predictions of deflation. On the company’s third-quarter earnings call in November, McMillon said the company could soon face a deflationary environment, where prices not just stabilize, but also decline. He said those lower prices could help customers pay for more discretionary items.

On Tuesday, however, Rainey told CNBC that deflation seems less likely now. “The possibility overall [of deflation] still remains, but prices are more stable than where they were three months ago,” he said.

Profit push

One reason for Walmart’s earnings growth? The company is selling more than just cereal, socks and shampoo.

Walmart has shifted into more profitable businesses — and that new model is a major part of its future. For instance, the retailer makes money from packing and shipping online orders for sellers that are part of its third-party marketplace. It had a delivery business that drops off purchases from major companies such as Home Depot, and local shops such as bakeries.

It’s also selling more ads, posting gains for the business of about 33% globally and 22% in the U.S. year over year.

Rainey told CNBC that the Vizio acquisition will be “an accelerant” for the “high-margin, fast-growing part of our business.” By using the TV’s operating system, Walmart could not only show ads, but also have better data that tracks how customers engage with the ad and if it leads to purchases.

The company has also boosted efficiency by adding automation to distribution centers that replenish store shelves and fulfillment centers that keep up with online orders.

At an investor day last year, Walmart spoke about how it planned to grow profits faster than sales over the next five years.

On an annual basis, Walmart now expects to grow sales more than 5% and operating income more than 8% on average, Rainey told investors on Tuesday’s earnings call.

Walmart’s e-commerce business is not yet profitable, but Rainey said the company is getting closer. He said the cost of fulfillment has fallen 20% over the past year, as the company drops off more packages on each delivery route and sells related services, such as online ads.

Customers are shopping more on Walmart’s website and app, which helps create those denser delivery routes. Weekly active e-commerce customers grew 17% over the past year, he said.

Expanding stores, boosting dividend

As many other companies have announced cost cuts, Walmart has done the opposite. It announced in late January that it would open or expand more than 150 stores in the U.S. over the next five years. That’s on top of an aggressive plan to upgrade more than 1,400 of its existing Walmart stores to have a more modern look.

Stores that have gotten that fresh design have had higher sales within their four walls and lifted sales in the surrounding market, Rainey told investors on the earnings call. He said the renovated stores make more room for online pickup and delivery orders and have improved Walmart’s reputation with shoppers.

Along with those store investments, Walmart said it would raise store manager wages to an average of $128,000 per year and make managers eligible for a bonus of up to 200% of their base salary.

It also announced a 3-for-1 stock split in late January, as shares hovered near an all-time high.

On Tuesday, Walmart said it would reward shareholders, too. It is raising its dividend by 9% this year, the largest increase in more than a decade.

Source link

#Walmart #beats #Wall #Streets #holiday #expectations #ecommerce #sales #soar

2 out of 5 industrial stocks are at record highs. Here’s our post-earnings outlook on all of them

Eaton Corporation signage at the NYSE

Source: NYSE

Earnings season was not perfect for our industrial-focused portfolio companies, but we’re feeling pretty good about their prospects for the rest of the year.

Source link

#industrial #stocks #record #highs #Heres #postearnings #outlook

Biogen revenue and profit shrink on Aduhelm costs, slumping sales of multiple sclerosis therapies

A Biogen facility in Cambridge, Massachusetts.

Brian Snyder | Reuters

Biogen on Tuesday reported fourth-quarter revenue and profit that shrank from a year ago, as it recorded charges related to dropping its controversial Alzheimer’s drug Aduhelm and as sales slumped in its multiple sclerosis therapies, the company’s biggest drug category.

Biogen booked sales of $2.39 billion for the quarter, down 6% from the same period a year ago. It reported net income of $249.7 million, or $1.71 per share, for the fourth quarter, down from net income of $550.4 million, or $3.79 per share, for the same period a year ago. Adjusting for one-time items, the company reported $2.95 per share.

The drugmaker’s fourth-quarter earnings per share, both unadjusted and adjusted, saw a negative impact of 35 cents associated with previously disclosed costs of pulling Aduhelm, which had a polarizing approval and rollout in the U.S.

Biogen is cutting costs while pinning its hopes on its other Alzheimer’s drugs, including its closely watched treatment Leqembi, and other newly launched products to replace declining revenue from its multiple sclerosis therapies.

Shares of Biogen closed more than 7% lower on Tuesday.

Here’s what Biogen reported for the fourth quarter compared with what Wall Street was expecting, based on a survey of analysts by LSEG, formerly known as Refinitiv: 

  • Earnings per share: $2.95 adjusted vs. $3.18 expected
  • Revenue: $2.39 billion vs. $2.47 billion expected

Also on Tuesday, Biogen issued full-year 2024 guidance that calls for adjusted earnings of $15 to $16 per share. Analysts surveyed by LSEG had expected full-year earnings guidance of $15.65 per share.

The drugmaker said it expects 2024 sales to decline by a low to mid-single digit percentage compared with last year. But the company anticipates its pharmaceutical revenue, which includes product revenue and its 50% share of Leqembi sales, to be flat this year compared with 2023.

Multiple sclerosis drug sales slump

Biogen’s fourth-quarter revenue from multiple sclerosis products fell 8% to $1.17 billion as some of the therapies face competition from cheaper generics.

The company’s once-blockbuster drug Tecfidera, which is facing competition from a generic rival, posted revenue that fell 17.8% to $244.3 million in the fourth quarter. Analysts had expected that drug to book sales of $233.1 million, according to FactSet.

Vumerity, an oral medication for relapsing forms of multiple sclerosis, generated $156.4 million in sales. That came in below analysts’ estimates of $174.4 million, FactSet estimates said. 

“We’ve had several years of declining revenue and profit, which is not unusual when you’re dealing with patent expirations,” Biogen CEO Christopher Viehbacher told reporters on a media call Tuesday. He added that one of the key ways Biogen will return to growth is to “reposition the company away from our legacy franchise of multiple sclerosis towards new products.”

Meanwhile, Biogen’s rare disease drugs recorded $471.8 million in sales, up 3% from the same period a year ago. 

Spinraza, a medication used to treat a rare neuromuscular disorder called spinal muscular atrophy, recorded $412.6 million in sales. That came under analysts’ estimate of $443.4 million in revenue, according to FactSet. 

Biogen’s biosimilar drugs booked $188.2 million in sales, up 8% from the year-earlier period. Analysts had expected sales of $196.7 million from those medicines.

Leqembi, other new drugs

The results come amid the rollout of Biogen and Eisai’s Leqembi, which became the first drug found to slow the progression of Alzheimer’s disease to win approval in the U.S. in July.

Eisai, which reported earnings last week, recorded $7 million in fourth-quarter revenue and $10 million in full-year sales from Leqembi.

Biogen CEO Viehbacher told reporters on the media call Tuesday that there are around 2,000 patients currently on Leqembi. That makes Biogen’s target of 10,000 patients by the end of March 2024 look increasingly difficult to hit, but Viehbacher emphasized that the company is focused more on the long-term reach of Leqembi rather than meeting that benchmark. 

“I think what’s important is we are now making progress,” he told reporters. “The 10,000 isn’t really hard and I think we are now really focusing on commercial plans — how do we get to the next 100,000?”

Notably, the low rate of adoption isn’t due to lack of demand: There are some 8,000 U.S. patients currently waiting to get on treatment, executives from Eisai said on an earnings call last week. 

More CNBC health coverage

The companies are also working toward Food and Drug Administration approval of an injectable version of Leqembi, which showed promising initial results in a clinical trial in October. 

Leqembi is currently administered twice monthly through the veins, a method known as intravenous infusion. The injectable form would be a new and more convenient option for administering the antibody treatment to patients, which could pave the way for higher uptake. 

But investors also have their eyes on other newly launched drugs. 

That includes Skyclarys from Biogen’s acquisition of Reata Pharmaceuticals in July. That drug brought in $56 million in fourth-quarter revenue, according to Biogen.

The FDA cleared Skyclarys last year, making it the first approved treatment for Friedreich ataxia, a rare inherited degenerative disease that can impair walking and coordination in children as young as 5.

On Monday, European Union regulators approved Skyclarys for the treatment of Friedreich ataxia in patients ages 16 and up. 

Biogen has also partnered with Sage Therapeutics on the first pill for postpartum depression, which won FDA approval in August. But the agency declined to clear the drug for major depressive disorder, which is a far larger commercial opportunity. 

Biogen said that pill, called Zurzuvae, generated roughly $2 million in sales for the fourth-quarter.

Don’t miss these stories from CNBC PRO:

Source link

#Biogen #revenue #profit #shrink #Aduhelm #costs #slumping #sales #multiple #sclerosis #therapies

Former hedge fund star says this is what will trigger the next bear market.

Much of Wall Street expects easing inflation, but an overshoot could dash hopes of a May rate cut, curtailing the S&P 500’s
SPX
waltz with 5,000, warn some.

Read: Arm’s frenzied stock rally continues as AI chase trumps valuation.

What might take this market down eventually? Our call of the day from former hedge-fund manager Russell Clark points to Japan, an island nation whose central bank is one of the last holdouts of loose monetary policy.

Note, Clark bailed on his perma bear RC Global Fund back in 2021 after wrongly betting against stocks for much of a decade. But he’s got a whole theory on why Japan matters so much.

In his substack post, Clark argues that the real bear-market trigger will come when the Bank of Japan ends quantitative easing. For starters, he argues we’re in a “pro-labor world” where a few things should be playing out: higher wages and lower jobless levels and interest rates higher than expected. Lining up with his expectations, real assets started to surge in late 2023 when the Fed started to go dovish, and the yield curve began to steepen.

From that point, not everything has been matching up so easily. He thought higher short-term rates would siphon off money from speculative assets, but then money flowed into cryptos like Tether and the Nasdaq recovered completely from a 2022 rout.

“I have been toying with the idea that semiconductors are a the new oil – and hence have become a strategic asset. This explains the surge in the Nasdaq and the Nikkei to a degree, but does not really explain tether or bitcoin very well,” he said.

So back to Japan and his not so popular explanation for why financial/speculative assets continue to trade so well.

“The Fed had high interest rates all through the 1990s, and dot-com bubble developed anyway. But during that time, the Bank of Japan only finally raised interest rates in 1999 and then the bubble burst,” he said.

He notes that when Japan began to tighten rates in late 2006, “everything started to unwind,” adding that the BOJ’s brief attempts [to] raise rates in 1996 could be blamed for the Asian Financial Crisis.

In Clark’s view, markets seem to have moved more with the Japan’s bank balance sheet than the Fed’s. The BOJ “invented” quantitative easing in the early 2000s, and the subprime crisis started not long after it removed that liquidity from the market in 2006, he notes.

“For really old investors, loose Japanese monetary policy also explained the bubble economy of the 1980s. BOJ Balance Sheet and S&P 500 have decent correlation in my book,” he said, offering the below chart:


Capital Flows and Asset Markets, Russell Clark.

Clark says that also helps explains why higher bond yields haven’t really hurt assets. “As JGB 10 yields have risen, the BOJ has committed to unlimited purchases to keep it below 1%,” he notes.

The two big takeaways here? “BOJ is the only central bank that matters…and that we need to get bearish the U.S. when the BOJ raises interest rates. Given the moves in bond markets and food inflation, this is a matter of time,” said Clark who says in light of his plans for a new fund, “a bear market would be extremely useful for me.” He’s watching the BOJ closely.

The markets

Pre-data, stock futures
ES00,
-0.41%

NQ00,
-0.80%

are down, while Treasury yields
BX:TMUBMUSD10Y

BX:TMUBMUSD02Y
hold steady. Oil
CL.1,
+0.79%

and gold
GC00,
+0.46%

are both higher. The Nikkei 225 index
JP:NIK
tapped 38,000 for the first time since 1990.

Key asset performance

Last

5d

1m

YTD

1y

S&P 500

5,021.84

1.60%

4.98%

5.28%

21.38%

Nasdaq Composite

15,942.55

2.21%

6.48%

6.20%

34.06%

10 year Treasury

4.181

7.83

11.45

30.03

42.81

Gold

2,038.10

-0.17%

-0.75%

-1.63%

9.33%

Oil

77.14

5.96%

6.02%

8.15%

-2.55%

Data: MarketWatch. Treasury yields change expressed in basis points

The buzz

Due at 8:30 a.m., January headline consumer prices are expected to dip to 2.9% for January, down from 3.4% in December and the lowest since March 2021. Monthly inflation is seen at 0.3%.

Biogen
BIIB,
+1.56%

stock is down on disappointing results and a slow launch for its Alzheimer’s treatment. A miss is also hitting Krispy Kreme
DNUT,
+1.99%
,
Coca-Cola
KO,
+0.24%

is up on a revenue rise, with Hasbro
HAS,
+1.38%
,
Molson Coors
TAP,
+3.12%

and Marriott
MAR,
+0.74%

still to come, followed by Airbnb
ABNB,
+4.20%
,
Akamai
AKAM,
-0.13%

and MGM Resorts
MGM,
+0.60%

after the close. Hasbro stock is plunging on an earnings miss.

JetBlue
JBLU,
+2.19%

is surging after billionaire activist investor Carl Icahn disclosed a near 10% stake and said his firm is discussing possible board representation.

Tripadvisor stock
TRIP,
+3.04%

is up 10% after the travel-services platform said it was considering a possible sale.

In a first, Russia put Estonia’s prime minister on a “wanted” list. Meanwhile, the U.S. Senate approved aid for Ukraine, Israel and Taiwan.

Best of the web

Why chocolate lovers will pay more this Valentine’s Day than they have in years

A startup wants to harvest lithium from America’s biggest saltwater lake.

Online gambling transactions hit nearly 15,000 per second during the Super Bowl.

The chart

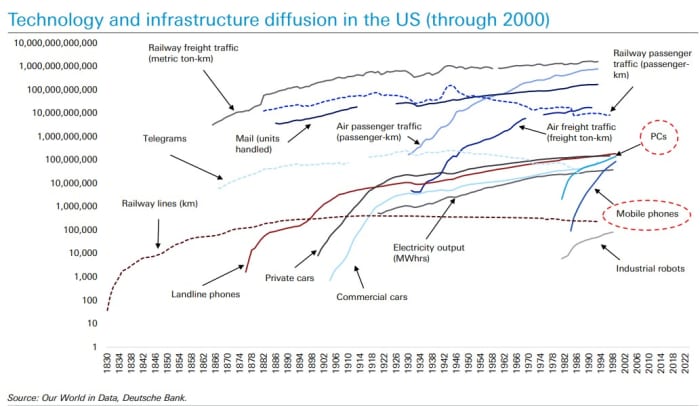
Deutsche Bank has taken a deep dive into the might of the Magnificent Seven, and why they will continue to matter for investors. One reason? Nearly 40% of the world still doesn’t have internet access as the bank’s chart shows:

Top tickers

These were the top-searched tickers on MarketWatch as of 6 a.m.

Ticker

Security name

TSLA,
-2.81%
Tesla

NVDA,
+0.16%
Nvidia

ARM,
+29.30%
Arm Holdings

PLTR,
+2.75%
Palantir Technologies

NIO,
+2.53%
Nio

AMC,
+4.11%
AMC Entertainment

AAPL,
-0.90%
Apple

AMZN,
-1.21%
Amazon.com

MARA,
+14.19%
Marathon Digital

TSM,
-1.99%
NIO

Random reads

Everyone wants this freak “It bag.”

Dumped over a text? Get your free dumplings.

Messi the dog steals Oscars’ limelight.

Love and millions of flowers stop in Miami.

Need to Know starts early and is updated until the opening bell, but sign up here to get it delivered once to your email box. The emailed version will be sent out at about 7:30 a.m. Eastern.

Check out On Watch by MarketWatch, a weekly podcast about the financial news we’re all watching – and how that’s affecting the economy and your wallet.

Source link

#hedge #fund #star #trigger #bear #market

The Hoax of Modern Finance – Part 7: The Illusion of Forecasting

Note to the reader: This is the seventh in a series of articles I’m publishing here taken from my book, “Investing with the Trend.” Hopefully, you will find this content useful. Market myths are generally perpetuated by repetition, misleading symbolic connections, and the complete ignorance of facts. The world of finance is full of such tendencies, and here, you’ll see some examples. Please keep in mind that not all of these examples are totally misleading — they are sometimes valid — but have too many holes in them to be worthwhile as investment concepts. And not all are directly related to investing and finance. Enjoy! – Greg


“Those who have knowledge don’t predict. Those who predict don’t have knowledge.” — Lao Tzu

So that there can be no confusion, I want to state my honest heartfelt opinion on forecasting: I adamantly believe there is no one who knows what the market will do tomorrow, next week, next month, next year, or at any time in the future—period.

Hindsight is a wonderful tool to use in order to know why something might have occurred in the past, but rarely is the cause known during the event itself. The prediction business is gigantic. William Sherden, in The Fortune Sellers, claimed that in 1998 the prediction business accounted for $200 billion worth of mostly erroneous predictions. Can you imagine with the growth of the Internet and globalization, what that industry is today? Frightening! As Oaktree Capital Management’s Howard Marks says, “You cannot predict, but you can prepare.”

Dean Williams, then-senior vice president of Batterymarch Financial Management, gave a keynote speech at the Financial Analysts Federation Seminar in August 1981, where he made some almost prophetic comments about investing that are as true today as they were then. He spoke about the relationship between physics and investing, but I have previously discussed that subject. Another comment was, “One of the most consuming uses of our time, in fact, has been accumulating information to help us make forecasts of all those things we think we have to predict. Where’s the evidence that it works? I’ve been looking for it. Really! Here are my conclusions: Confidence in a forecast rises with the amount of information that goes into it. But the accuracy of the forecast stays the same.” Later on, he added, “It’s that you can be a successful investor without being a perpetual forecaster. Not only that, I can tell you from personal experience that one of the most liberating experiences you can have is to be asked to go over your firm’s economic outlook and say, ‘We don’t have one.'” He goes on to talk about using simple approaches versus complex ones, delving into the fact that they also must be consistent approaches. This is a must-read; you can find it from an Internet search on Dean Williams Batterymarch.

Sherden states that the title “second oldest profession” usually goes to lawyers and consultants, but prognosticators are the rightful owners. Early records from 5,000 years ago show that forecasting was practiced in the ancient world in the form of divination, the art of telling the future by seeing patterns and clues in everything from animal entrails to celestial patterns. As Isaac Asimov wrote in Future Days, such was the eagerness of people to believe these augers that they had great power and could usually count on being well supported by a grateful, or fearful, public. I’m not so sure most of this isn’t applicable to today. Sherden did much research into the numbers of people directly involved in forecasting—and this data was from 1998. They are staggering and growing. And let’s not forget that one of the largest-selling newspapers in the country is the National Enquirer. Below are some of the findings on forecasting from Sherden’s book.

  • No better than guessing.
  • No long-term accuracy.
  • Cannot predict turning points.
  • No leading forecasters.
  • No forecaster was better with specific statistics.
  • No one ideology was better.
  • Consensus forecasts do not improve accuracy.
  • Psychological bias distorts forecasters.
  • Increased sophistication does not improve accuracy.
  • No improvement over the years.

A weather forecaster will have an exceptional record if he says simply that tomorrow will be just like today. If I were a weather forecaster, I would tend to err on the side of bad weather instead of good weather. Then, if you are wrong, most will not notice. It is when you forecast good weather, and it is not, that they will notice. Most market prognosticators tend to have a bullish or a bearish bias in their forecasts. Bullish forecasts are generally well-accepted, especially by the Wall Street community, and bearish forecasting is a giant business because it infringes on investors’ fears.

“Given the difficulties forecasting the future, it is very useful to simply know the present.” — Unknown

Barry Ritholtz (The Big Picture blog) recently pointed out how ridiculous the forecasting business has become. In particular, the end-of-the-year forecasts for the next year or the best stocks to own. Here is an example from the August 14, 2000, issue of Fortune magazine by David Rynecki on “10 Stocks to Last the Decade.”

August 14, 2000

  • Nokia (NOK: $54)
  • Nortel Networks (NT: $77)
  • Enron (ENE: $73)
  • Oracle (ORCL: $74)
  • Broadcom (BRCM: $237)
  • Viacom (VIA: $69)
  • Univision (UVN: $113)
  • Charles Schwab (SCH: $36)
  • Morgan Stanley Dean Witter (MWD: $89)
  • Genentech (DNA: $150)

Closing Prices December 19, 2012

  • Nokia (NOK: $4.22)
  • Nortel Networks ($0)
  • Enron ($0)
  • Oracle (ORCL: $34.22)
  • Broadcom (BRCM: $33.28)
  • Viacom (VIA: $54.17)
  • Univision ($?)
  • Charles Schwab (SCH: $14.61)
  • Morgan Stanley Dean Witter (MWD: $14.20)
  • Genentech (Takeover at $95 share)

Ritholtz goes on to say, “The portfolio managed to lose 74.31 percent, with three bankruptcies, one bailout, and not a single winner in the bunch. Even the Roche Holdings takeover of Genentech was for 37 percent below the suggested purchase price. Had you merely bought the S&P 500 Index ETF (SPY), you would have seen a gain of over 23 percent.”

On March 11, 2008, CNBC’s Mad Money host, Jim Cramer, emphatically said it was foolish to move money out of Bear Stearns. He claimed that Bear Stearns was just fine. He was totally wrong. A week later, JPMorgan agrees on March 16 to buy Bear for $236 million, or $2 a share, representing just over 1 percent of the firm’s value at its record high close just 14 months earlier. The deal essentially marked the end of Bear’s 85-year run as an independent securities firm. On Monday, March 17, Bear shares closed at $4.81 on optimism another buyer may emerge. The average target price: $2. Don’t confuse advice from someone in the entertainment business with advice from someone who manages money. In fact, don’t pay attention to anyone’s predictions. No one knows the future!

The Reign of Error

In 1987, a book was written entitled The Great Depression of 1990, by Dr. Ravi Batra, an SMU professor of economics. Sadly, I bought and read that book. Batra was claimed as one of the great theorists in the world and ranked third in a group of 46 superstars selected from all economists in American and Canadian universities by the learned journal Economic Inquiry (October 1978). The foreword was written by world-renowned economist Lester Thurow, who said The Great Depression of 1990 is crucial reading for everyone who hopes to survive and prosper in the coming economic upheaval. The title for one chapter was “The Great Depression of 1990–96.” Not only did he pronounce the beginning of it, he also proclaimed to know the end.

The 1990s saw the largest bull market in history, with the Dow Industrials rising from 2,700 to over 11,000 during the decade of the 1990s. By the end of the decade, we were flooded with books about the never-ending bull market, such as Dow 40,000 by Elias, Dow 36,000 by Glassman and Hassett, and Dow 100,000 by Kadlec. From 2000 until early 2003, we witnessed a bear market that removed most of the gains of the previous 10 years, with the Dow Industrials back down to about 7,350.

“We are making forecasts with bad numbers, but bad numbers are all we have.” — Michael Penjer

 These forecasts were dead wrong; however, I ‘m sure the authors sold a lot of books. The bad news in the stock market did not end after the bear market from 2000 to 2003; by March 2009, the Dow Industrials was below the level of the previous bear by another 8 percent. Agencies whose duty is to make forecasts were almost universally wrong during the 2006 to 2007 period, with forecasts of the economy, the markets, and the world outlook all positive; even the ones that weren’t quite as rosy were only modestly so. The business magazines were the same. How many forecasts do you find yourself reading and listening to? Did you ever research to see if any of them ever turned out to be correct? Or even close?

Finance is not the same as physics, in that no mathematical model can fully capture the large number of always changing economic factors that cause big market moves—the financial meltdown of 2008 is an example. Emanuel Derman says, “In physics, you’re playing against God; in finance, you’re playing against people.” The parallelism between physics and finance has gained support from author Nassim Taleb, who says, “It doesn’t meet the very simple rule of demarcation between science and hogwash.” Whether invoking the physicist Richard Feyman or the late Fischer Black, the use of mathematical models to value securities is an exercise in estimation. Derman further states, “You need to think about how to account for the mismatch between models and the real world.”

“Science is a great many things, but in the end they all return to this: Science is the acceptance of what works and the rejection of what doesn’t. That needs more courage that we might think.” — Jacob Bronoski

Long Term Capital Management (LTCM) was started by John Meriwether, who had a great following along with Myron Scholes and Robert Merton, two famous economists. Together, they grew LTCM into assets of more than $130 billion, using a model they claimed would achieve exceptional returns without the usual risk. That alone should have been all the warning anyone needed. In 1997, their model did not do well, and by mid-1998 they had lost all of it; they had borrowed more than a trillion dollars to make investments. The story ended in September 1998, when the New York Federal Reserve Bank led a group of organizations to step in and bail them out; shortly thereafter, there was no more LTCM. Academics with sophisticated models are a dangerous lot. And here’s the best part—just before the demise, Scholes and Merton won the Nobel Prize for economics for their efforts in financial risk control.

LTCM was not alone; stories of hundreds of funds have gone out of business after short periods of exceptional success. Rogue trades were rampant. Remember Nick Lesson of Barings Bank? How about Jerome Kerviel of Societe Generale, or a host of large banks during the period? The list is long and growing. Enron, WorldCom, and Global Crossing were just a few large companies that went bankrupt, taking their employees’ pensions and investments with them. I don’t recall anyone ever anticipating any of these failures; forecasters never do.

After the inflationary decade of the 1970s, the price of gold was soaring. In the early 1980s, forecasts of gold reaching unbelievable heights were everywhere. They were supported with the facts that gold’s fixed value was released in 1971 and it was free to trade, and trade it did. The Hunt Brothers had bought a large portion of the silver market. No forecaster saw anything but higher prices. I recall buying three 100-ounce bars and wishing I had more money to buy more. You will see in Chapter 11 on drawdowns that gold plummeted in 1981, and it took more than 25 years to get back to its peak. And by 2013, the forecasts of gold going to the moon were everywhere.

At what point will we start to believe that forecasting is a hoax? This book is about the stock market, where the forecasting business is huge. I can tell you this: stock market forecasters are no different than economic forecasters. The ones who get lucky with a forecast are the ones who have yet to be wrong. I think the worst of them are the ones I call outliers (not to be confused with outlaws); these are the ones who, through some stroke of luck, make a forecast about something big and it turns out to actually happen. However, it is rarely in the exact manner of the forecast, but that is soon forgotten as he or she is paraded through the financial media as the guru of the year. They start newsletters, hold conferences, and embark on periods of more and more forecasts because they are now experts. Yet, most rarely make another correct forecast. John Kenneth Galbraith said: “When it comes to the stock market, there are two kinds of investors: those who do not know where it is going, and those who do not know that they do not know where it is going.”

An Investment Professional’s Dilemma

When speaking to investment advisors, I often remind them that they must deal with two realities:

  1. Your clients expect you to have answers.
  2. The market is unpredictable.

Once you have your clients believing #2, then the questions for #1 will be easier to answer. Most advisors, and especially their clients, get caught up in the moment and are easily swayed into believing that some expert actually knows the future. Or that they focus on the recent past and extrapolate that ad infinitum.

“Mind you, you should take economic forecasts—even my own—with a big grain of salt.” John Kenneth Galbraith may have been more right than econometricians like to think when he said that “The only function of economic forecasting is to make astrology look respectable.”

Nobel Prize-winning economist Kenneth Arrow has his own perspective on forecasting. During World War II, he served as a weather officer in the U.S. Army Air Corps, working with individuals who were charged with the particularly difficult task of producing month-ahead weather forecasts. As Arrow and his team reviewed these predictions, they confirmed statistically what you and I might just as easily have guessed: The Corps’ weather forecasts were no more accurate than random rolls of a die. Understandably, the forecasters asked to be relieved of this seemingly futile duty. Arrow’s recollection of his superiors’ response was priceless: “The commanding general is well aware that the forecasts are no good. However, he needs them for planning purposes.” (Peter Bernstein, Against the Gods)

“You don’t need a weatherman to know which way the wind blows.” — Bob Dylan

The book Dance with Chance by Spyros Makridakis (an author who wrote a wonderful business-forecasting book a couple of decades ago) gives a short story about Karl Popper. Popper was a philosopher of science born in Austria. In the 1930s, he leveled a charge against Sigmund Freud, whose psychoanalytical theories had gained widespread acceptance. Popper pointed out that real scientists start with conjectures, which they then try to refute—as well as seeking evidence to support them. Only by failing to disprove their hypotheses, can they prove they were correct. Meanwhile pseudoscientists, as Popper called them, only look for events that prove their theories correct. Theories like this are little more than untested assertions. That’s not to say the assertions can’t eventually turn out to be right, but we can only reach this conclusion once someone has tested them.

“Forecasting the future is much more difficult than forecasting the past.” — Unknown

Forecasting the future of monetary, economic, financial, or political possibilities has a serious flaw in that regardless of if your forecast is close to being correct, or even if it is spot on, the assumption about how the market will react is where the big problem lies. There is a flawed belief that positive events from political, economic, and monetary news will reflect positively on the markets. Conversely, negative news events will reflect negatively on the markets. This simply is not true. You can see that there is hardly any usable correlation to these events and the markets; earnings announcements are a perfect example. How many times have they been positive and the stock market did not react accordingly? The gap between a good economic or monetary forecast and the reality of what the market does is huge.

“There is always a reason for a stock acting the way it does. But also remember that chances are you will not become acquainted with that reason until sometime in the future, when it is too late to act on it profitably.” — Jesse Livermore

The following (slightly modified) comes from Gary Anderson, who wrote the must-read book entitled The Janus Factor. The link between fundamentals and price is elastic, and rarely still. At times, good earnings reports cause the price of a stock to rise, while at other times traders use positive earnings news to sell the same stock. Will a global crisis increase the value of the dollar or send it lower? The linkage between change in the world and change in the market is often ambiguous and sometimes just plain mysterious. In most cases, human beings are clever enough to create plausible stories to account for the market’s response to events, but too often only with the aid of hindsight. There is a constant shift in the fundamental reasoning used to support decisions to buy and sell. The financial media is constantly justifying each move in the market with whatever recent event they can find that supports that move. Fundamental conventions supporting buy/sell decisions can vary from period to period and have no place in rational investing.

We can draw a useful distinction between reasons and causes. Earnings do not cause prices to move, nor do research reports, news bulletins, talking heads, dividends, stock splits, the economy, peace, or war. These factors may be reasons motivating traders to buy and sell, but the direct cause of a stock’s price movement is the buying and selling activity of traders and investors. We focus on causes, not reasons—on what traders do, not why. This is accomplished by measuring price and price derivatives (breadth, relative strength) of price movement.

Gurus/Experts

What would we do without all the experts, gurus, pontificators, purveyors of gloom and doom, and, of course, the perma-bulls and perma-bears?

First of all, a giant industry would be gone, an industry that generates billions of dollars in the USA alone. I’m not going to spend a great deal of time on this, because the website of CXO Advisory Group LLC, CXOadvisory.com , does all the heavy lifting. They have an entire section devoted to GURUS. Here are the two questions they ask at the beginning of that section: “Can experts, whether self-proclaimed or endorsed by others (publications), provide reliable stock market timing guidance? Do some experts clearly show better intuition about overall market direction than others?” They address these questions with a logical and transparent process. After following more than 60 experts and thousands of observations, near the end of the Guru section, they conclude: “The overall accuracy of the group, based on both raw forecast count and on the average of forecaster accuracies (weighting each individual equally) is 47 percent. In summary, stock market experts as a group do not reliably outguess the market. Some experts, though, may be better than others.” Hmmm! It seems like a coin toss, on average, would do better.

Additionally, CXOadvisory.com reviews numerous academic papers, and then does its own backup analysis to determine if the paper’s author and they agree. An excellent piece, when reviewing Charles Manski’s July 2010 paper entitled “Policy Analysis with Incredible Certitude,” categorizes incredible analytical practices and underlying certitude. These four are:

  1. Conventional certitudes (conventional wisdom)—Predictions (indicators) that experts generally accept as accurate, but are not necessarily accurate.
  2. Dueling certitudes—Two contradictory predictions that competing experts present as exact, with no expression of uncertainty (leading to conflicting strong investment strategy recommendations).
  3. Conflating science and advocacy—Developing arguments (assumptions) that support an investment strategy rather than an investment strategy that supports evidence-based arguments, while portraying the deliberative process as scientific.
  4. Wishful extrapolation—Drawing a conclusion about some future situation based on historical tendencies and untenable assumptions (ignoring differences between the historical and future situations, and emphasizing in-sample over out-of-sample testing).

If you have ever watched television, read a newsletter, or attended a seminar, I’m sure the above sounds familiar. People who appear as experts generally aren’t any better than the masses; however, when they are wrong, they are rarely held accountable, and never admit it (generally). They will respond that their timing was just off or some catastrophic event caught them off guard, or worse—wrong for the right reasons.

There is a book by Philip Tetlock, Expert Political Judgement: How Good Is It? How Can We Know?, that deals with the business of prediction. Tetlock claims that the better-known and more frequently quoted they are, the less reliable their guesses about the future are likely to be. The accuracy of their predictions actually has an inverse relationship to his or her self-confidence, renown, and depth of knowledge. Listen to experts at your own risk.

Larry Williams was an active and renowned trader before I even began to show interest in the markets. There is one significant point that Larry has made consistently that needs to be repeated here. If you are going to be mentored by someone, if you are going to read someone’s book on trading/investing, if you are going to sign up for a course of instruction from someone, please make sure they are qualified to teach the subject. This does not always translate into how they trade or invest. Like Larry says in his Trading Lesson 16, Kareem Abdul-Jabbar tried coaching and was a disaster at it; Mark Spitz’s swimming coach could not swim. However, the bottom line is that the best teachers are probably the ones who actually trade and invest, as they have firsthand experience to the nuances of the skill. This argument is not unlike the one between the ivory tower academics and those involved in the real world applying their craft every day. While they may have considerable talent to offer, your chances are probably better with a real practitioner.

Masking an Intellectual Void

My formal education was in aerospace engineering. My education in “The World of Finance” came and continues to come from people in the investment industry I have grown to respect. I hate to list some as fear of leaving someone out, but Ed Easterling, John Hussman, and James Montier are certainly at the top of the list. Are these professionals always correct? Of course not, but they usually admit it and they write in such a manner that they know the uncertainty is always there and yet present valid arguments on a wide range of topics and concepts. The rest of the learning comes for reading literally hundreds and hundreds of white papers in finance and economics. This process caused my concern at the insane use of advanced mathematics, usually in the form of partial differential equations, to supposedly assist in making the point that the paper was addressing. I cannot tell you how many times I thought that most of the math was unnecessary and more often than not the paper would have stood alone without the math. In many instances I think there is an attempt by most to overly complicate their work with mathematics with the belief that it brings credibility to their work. Another reason, and one I certainly cannot prove, is that they also know that most people who read their paper, other than their peers, will not grasp the math and just assume it is valid and necessary.

The senior special writer, Carl Bialik, of The Wall Street Journal, who writes a section called “The Numbers Guy”, is one of my favorite reads. As I was wrapping up research for this book and thinking that I had included enough opinions about things without substantial evidence, I was delighted to find support from Carl for this section on “Masking an Intellectual Void.” On January 4, 2013, he wrote two articles entitled, “Don’t Let Math Pull the Wool Over Your Eyes,” and “Awed by Equations.” Those articles referenced two papers that gave support to my belief in the overuse of mathematics, and how readers of white papers generally were impressed with what they actually did not understand. Research was conducted using only the abstracts of two papers, one without math, and one with math; the catch being that the one with math was bogus, totally unrelated to the paper. Yet the highest percentage of participants who gave the highest rating to the abstract with added math, based on the participants’ educational degree, was as follows:

Math, Science, Technology      46 percent 

Humanities, Social Science     62 percent 

Medicine            64 percent 

Other           73 percent 

I think this shows that those who had a high probability of not understanding the math gave the paper with the bogus math a higher rating, while those who possibly did understand the math did not.

This is just my lame attempt at humor. The financial academics have almost universally used partial differential equations in their white papers; I think, more often than not just to hide an intellectual void. Many times, the difficult math is not necessary, but by including it, they know most will never be able to question their work. Sad, indeed! Incidentally, the equation can be simplified to 1 + 1 = 2.

Earnings Season

For decades, I have watched the parade of earnings announcements and how the media hangs on each one as if it actually had some value other than filling dead air. Figure 5.1 shows the stock price of Amazon back in the 2000-2001 bear market. The annotations are from actual earnings forecasts from analysts. If you yell “buy” all the way down, the odds are good that you will eventually be correct. Hopefully, you will still have some money.

“In our view, security analysts as a whole cannot estimate the future earnings pattern of one or more growth stocks with sufficient accuracy to provide a firm basis for valuation in the majority of cases.” — Benjamin Graham

It seems that the media is so focused on earnings reports that they forget to report the actual earnings. Instead, their focus is on where the earnings came in relative to the analysts’ estimate. After beating up on experts, it is hard to imagine that someone would actually make an investment decision based on an analyst’s (expert) guess as to what earnings should be. These analysts are constantly wined and dined by the companies they analyze, so, in general, I think they are biased, and almost always to the upside. In fact, I think most are really just trend followers, in that they are always forecasting better earnings as markets rise and, once a market rolls over and begins to decline, they eventually begin to forecast lower earnings.

Figure 5.1

When asked what investors’ greatest problems are, the late Peter Bernstein said, “Extrapolation! They believe the recent past is how the future will be.”

Are Financial Advisors Worth 1% of AUM (Assets Under Management)?

“People who need advice are least likely to take it.” — Unknown

Many asset managers hold entirely too many stocks and have become closet benchmark trackers. If they beat their benchmark, they call it alpha, and when they do not beat their benchmark, they call it tracking error. If your investment manager rebalances your portfolio periodically based on a few questions that he required you to answer when setting up the account, here are some things to think about. Usually, the risk tolerance and objective questionnaire is much more involved, but here are two questions typically asked:

  1. What percentage of current income will you need when you retire?
  2. On a scale from 1 to 7, what is your risk tolerance?

Do you honestly believe a person knows the answers to those questions? No way! They will try to answer based on what the advisor has told or suggested to them. The law requires this type of action for advisors, so pick an advisor you think will actually meet your needs and, if you are unsure, can point you in the right direction.

Economists Are Good at Predicting the Market

“The economy depends about as much on economists as the weather does on weather forecasters.” — Jean Paul Kauffman

Just to put this into perspective, the stock market is a component of the index of leading indicators. If the stock market is a good leading indicator of the economy, why ask an economist what the market is going to do? Yet they are paraded daily across the financial media, making forecasts about the markets, political policy, fiscal policy, monetary events, and, yes, occasionally about the economy. When they are correct, they won’t let you forget it; when they are wrong, no one remembers. Many economists are good when dealing with the economy, but rarely are they good when they stray into other areas.

News Is Noise

Here is a humorous attempt to portray some of the daily noise often referred to as news. On Wall Street today, news of lower interest rates sent the stock market up, but then the expectation that these rates would be inflationary sent the market down, until the realization that lower rates might stimulate the sluggish economy pushed the market up, before it ultimately went down on fears that an overheated economy would lead to once again an imposition of higher interest rates.

Rolf Dobelli, writing for The Guardian, on April 12, 2013, in an article entitled “News is bad for you—and giving up reading it will make you happier,” listed these problems with news:

  • News misleads.
  • News is irrelevant.
  • News has no explanatory power.
  • News is toxic to your body.
  • News increases cognitive errors.
  • News inhibits thinking.
  • News works like a drug.
  • News wastes time.
  • News makes us passive.
  • News kills creativity.

He claims he has gone without news for four years and says it isn’t easy, but it’s worth it. Since he wrote for a news organization, I would imagine he is also looking for work.

“If you can distinguish between good advice and bad advice, then you don’t need advice.” — VanRoy’s Second Law

When asked at seminars what is the single most important concept to understand when investing, I respond simply that it is to know thyself. The human mind is a horrible investor, and the use of heuristics does not help. The next chapter deals with human behavior as it relates to the market.


Thanks for reading this far. I intend to publish one article in this series every week. Can’t wait? The book is for sale here.

Source link

#Hoax #Modern #Finance #Part #Illusion #Forecasting