Stock-market rally faces make-or-break moment. How to play U.S. October inflation data.

It has been a while since a hot inflation report sparked wild gyrations in U.S. stocks, like it frequently did in 2022, but that doesn’t mean Tuesday’s consumer price index for October is destined to be a snooze-fest for markets.

To the contrary, some Wall Street analysts believe it is possible, even likely, that the October CPI report could emerge as a critical catalyst for stocks, with the potential to propel the market higher on a softer-than-expected number.

At least one prominent economist expects the data to show that consumer prices were largely unchanged last month, or even fell.

“I would not be surprised to see a negative CPI inflation print for October,” said Neil Dutta, head of economics at Renaissance Macro Research, in commentary emailed to MarketWatch.

“After all, retail gasoline and heating oil prices declined a little over 10% over the month and we know that energy, while representing a small share of total CPI, roughly 7%, can account for a large chunk of the month-to-month swings in CPI.”

Markets at a crossroads

The October CPI report arrives at a critical juncture for markets. Investors are trying to anticipate whether the Federal Reserve will follow through with one more interest rate increase, as it indicated in its latest batch of projections, released in September.

Speaking on Thursday, Federal Reserve Chairman Jerome Powell left the door open to another move, but qualified this — as the Fed almost always has — by insisting that whatever the Fed decides, it will ultimately depend on the data.

These comments added even more emphasis to next week’s data, said Thierry Wizman, Macquarie’s global FX and interest rate strategist, in commentary emailed to MarketWatch on Friday.

“Our own view — expressed over the past few days — is that the Fed — and by extension the fixed-income markets — won’t be anticipatory. Rather, the Fed will be highly reactive to the data,” he said. “The next milestone is…CPI. It is likely to have a calming effect on markets, as traders weigh the prospect that a very low headline CPI result will further cool the prospect of excessive wage demands in the labor market.”

Asymmetric risks

While assessing the potential impact of a soft inflation report next week, at least one market analyst expects the market’s reaction to the June CPI report, released on July 12, might serve as a helpful template.

Stocks touched their highest levels of the year within that month, as many interpreted the slower-than-expected increase in prices as an important turning point in the Fed’s battle against inflation. The S&P 500 logged its 2023 closing high on July 31, according to FactSet data,

Tom Lee, who anticipated both the outcome of the June CPI report and the market’s reaction, told MarketWatch that, at this point, inflation would need to meaningfully reaccelerate to have an adverse impact on the stock market.

The upshot of this is that the risks for investors heading into Tuesday’s report are likely skewed to the upside. Even a slightly hotter-than-expected number likely wouldn’t be enough to derail the market’s November rebound rally. While a soft reading could reinforce expectations that the Fed is done hiking rates, likely precipitating a rally in both stocks and bonds.

“I’d say the setup looks pretty favorable,” Lee said.

Even a modestly hotter-than-expected number likely wouldn’t be enough to derail the market’s November rebound.

“I think the reaction function is changing for the stock market,” Lee said.

“Because the Federal Reserve and public market kind of viewed the September CPI as a pretty decent number, and Powell even referred to it as such. Earlier in 2023, I think people would have viewed it as a miss.”

U.S. inflation has eased substantially since peaking above 9% on a year-over-year basis last summer, the highest rate in four decades. The data released last month showed consumer prices climbed 0.4% in September, softer than the 0.6% from the prior month, but still slightly above expectations.

However, the more closely watched “core” reading reflected only a 0.3% increase, which was in-line with expectations.

How long will the ‘last mile’ take?

There is a perception on Wall Street and within the Federal Reserve that driving inflation down from 3% to the Fed’s 2% target could pose more difficulty for the Fed. After all, most of the easing from last summer’s highs was driven by falling commodity prices and supply-chain normalization as the economic impact of the COVID-19 pandemic faded.

Powell has repeatedly warned of a “bumpy ride,” and he reiterated on Thursday that the battle against inflation is far from over.

See: Powell says Fed is wary of ‘head fakes’ from inflation

Inflation data released this month, and in the months to come, could help to define investors’ expectations for how long this “last mile” might take, helping these reports regain their significance for markets.

“I like a calm market, but I think CPI is coming more in focus these days now that we’re getting closer to that 2% target,” said Callie Cox, U.S. investment analyst at eToro, during a phone call with MarketWatch.

Since the start of 2023, the S&P 500 index hasn’t seen a single move of 1% or greater on a CPI release day, according to FactSet data. By comparison, the biggest daily swings seen in 2022 occurred on CPI days, with the large-cap index sometimes swinging 4% or more in a single session.

Economists polled by FactSet expect consumer prices rose 0.1% in October, following a 0.4% bump in September. They expect a 0.3% increase for core prices, which excludes volatile food and energy. Powell has said that he’s keeping a close eye on core inflation, as well as so-called “supercore” inflation, which measures the cost of services inflation excluding housing.

To be sure, the CPI report isn’t the only piece of potentially market-moving news due during the coming week. Investors will also receive a monthly update from the Treasury that includes data on foreign purchases and sales of Treasury bonds, as well as a flurry of other economic reports, including potentially market-moving readings on housing-market and manufacturing activity.

There is also the producer-price index, another closely watched barometer of inflation, which is due out Thursday.

U.S. stocks have risen sharply since the start of November, with the S&P 500
SPX
up more than 5.3%, according to FactSet data.

Source link

#Stockmarket #rally #faces #makeorbreak #moment #play #October #inflation #data

Santa May Be Warming Up His Sled; What’s Next? Watch the Fed and the Bond Market

The traditional year-end rally may have started with last week’s liftoff on Wall Street, as the Fed’s rate hikes start to bite and the economy shows signs of slowing. Investors hope the economy slows just enough to reduce inflation.

The stock market seems to have bottomed, as short sellers panicked and recently frightened buyers rushed back into the markets. It’s about time, as the signs of a pending reversal have been in place for the past two months, namely a slowing economy and fears about the Fed’s rate hike cycle, which have been mounting as investor’s pessimism rose to a fever pitch. Moreover, the self-perpetuating talk of doom loops led to a bout of panic selling, which reversed as the Fed held rates steady and Friday’s employment report showed a cooling in the labor market.

Of course, there are no certainties in any market. And this rally could easily fizzle. But the longer stocks hold up and bond yields remain subdued, the higher the odds of the rally intensifying.

Buckle up! Santa may be warming up his sled.

The Signs Were There

I’ve been expecting a major reversal in both bonds and stocks since September when the selling in the U.S. Treasury market, and the subsequent rise in yields entered an absurd trading pattern. I chronicled the entire process, including the likelihood of a pending reversal in bond yields on October 15, 2023, when I wrote:

“The slightly-hotter-than-predicted PPI and CPI numbers certainly put a temporary damper on the recent short-covering rally in stocks and bonds, raising investor fears about further interest rate increases. But, as I’ve noted recently, fear is often the prelude to a buying opportunity. Such an opportunity may be developing in the U.S. Treasury Bond market and related interest-sensitive sectors of the stock market, such as homebuilders, real estate investment trusts, and select technology stocks.”

Prior to that, I had suggested that a historic buying opportunity in homebuilder stocks was approaching, while providing an actionable trading plan for such a development here.

Last week, in this space, I wrote: “The stock market is increasingly oversold, so investors should prepare for a potential bounce before the end of the year, especially given the usual bullish seasonality which begins in November and can run through January.”

Bond Yields Crash and Burn and Stocks Respond with Bullish Reversal and Broad Rally

What a difference a week makes, especially in the strange world of the U.S. Treasury bond market. Just two weeks ago, the U.S. Ten Year note yield (TNX) tagged 5%, a chart point which triggered heavy selling in stocks from the mechanical trading crowd, also known as commodity trading advisors (CTAs) and their hedge fund brethren. The selling was further enhanced by headlines about mortgage rates moving above 8%.

But as I noted here, the selling spree had the smell of panic, especially given the lack of a new low in the RSI indicator, when the New York Stock Exchange Advance Decline line (NYAD), as I describe below, made a lower low. The key was whether NYAD broke below its March lows, which it didn’t. This provided the perfect setup for a massive short squeeze, which is currently unfolding.

Here are some details. The U.S. Ten Year Note yield has rolled over, with two significant technical developments occurring:

  • TNX is now trading inside the upper Bollinger Band, which is two standard deviations above its 200-day moving average. This marks a return to a “normal” trading pattern;
  • It is also testing its 50-day moving average and the 4.5% yield area. Normal trading action suggests that a consolidation in this area should occur before TNX makes a move toward 4.3%; and
  • Bullishly for the homebuilder and housing-related real estate stocks, as well as the rest of the market, mortgage rates seem to have topped out as well.

Moreover, as I discuss below, the rally seems be quite broad, as measured by the New York Stock Exchange Advance Decline line. In addition, money is moving back into large-cap technology stocks, as in the Invesco QQQ Trust (QQQ), which also rebounded above its 50-day moving average. Especially encouraging on this price chart is the rally in On Balance Volume (OBV), which signals that the rally is being fueled by real buying along with short-covering, as evidenced by a rising ADI line.

Big tech certainly got a boost, as Microsoft (MSFT) continued its recent climb and is approaching a potential breakout which, if left unhindered, could well take the stock to the $400 area in the next few weeks.

But it’s not just big tech that’s rising. A less obvious member of the QQQ stable, food producer and packager Mondelez (MDLZ), has been quietly moving higher and is now approaching its 200-day moving average. MDLZ’s On Balance Volume (OBV) line is rising nicely as money piles into the shares.

Huge Potential Gains Lurk in Homebuilders

Even better is the unfolding rebound above the 200-day moving average in the SPDR S&P Homebuilders ETF (XHB), where OBV is exhibiting an equally bullish trading pattern. As I noted above, I issued a Buy alert on the homebuilders a few weeks ago, and thus subscribers to my service have been well-positioned for this move in the sector.

Consequently, the rally in the homebuilders may just be starting, especially if interest rates don’t rise dramatically from current levels. As the price chart above shows, mortgage rates may have topped out, along with bond yields. This reversal is already being reflected in the bullish action visible in the homebuilder stocks. Note the following:

  • Rates are still trading above normal long term trends. 
  • The upper purple line on the chart is two standard deviations above the 200-day moving average.
  • Since mortgage rates follow the trend in TNX (above), the odds favor a further decline in mortgage rates, with the first downside target being 6.5%.

Note the nearly perfect correlation between falling bond yields (TNX), falling mortgage rates, and rising homebuilder stocks (SPHB).

Join the smart money at Joe Duarte in the Money Options.com. You can have a look at my latest recommendations FREE with a two-week trial subscription. And for frequent updates on real estate and housing, click here.

Incidentally, if you’re looking for the perfect price chart set up, check out my latest YD5 video, where I detail one of my favorite bullish setups. This video will prepare you for the next phase in the market. 

Market Breadth Reverses Bearish Trend

The NYSE Advance Decline line (NYAD) did not remain below is March lows for long, and has now nearly fully reversed its bearish trend as it approaches its 200-day moving average. The price chart below shows the similarity between the unfolding market bottom and that which occurred in October 2022. The circled areas highlight this super cool technical phenomenon where the lack of a new low in the RSI, when NYAD made a new low, marked the bottom. Also note the double top in VIX, which is also repeated.

The Nasdaq 100 Index (NDX) rallied above its 50-day moving average, with both ADI and OBV turning higher as short sellers cover (ADI) and buyers move in (OBV).

The S&P 500 (SPX) also rebounded above its 200-day moving average, returning to bullish territory after its recent dip below 4150.

VIX is Back Below 20

The CBOE Volatility Index (VIX) didn’t stay above the 20 level for long, which is a bullish development.

When the VIX rises, stocks tend to fall, as rising put volume is a sign that market makers are selling stock index futures to hedge their put sales to the public. A fall in VIX is bullish, as it means less put option buying, and it eventually leads to call buying, which causes market makers to hedge by buying stock index futures. This raises the odds of higher stock prices.


To get the latest information on options trading, check out Options Trading for Dummies, now in its 4th Edition—Get Your Copy Now! Now also available in Audible audiobook format!

#1 New Release on Options Trading!

Good news! I’ve made my NYAD-Complexity – Chaos chart (featured on my YD5 videos) and a few other favorites public. You can find them here.

Joe Duarte

In The Money Options


Joe Duarte is a former money manager, an active trader, and a widely recognized independent stock market analyst since 1987. He is author of eight investment books, including the best-selling Trading Options for Dummies, rated a TOP Options Book for 2018 by Benzinga.com and now in its third edition, plus The Everything Investing in Your 20s and 30s Book and six other trading books.

The Everything Investing in Your 20s and 30s Book is available at Amazon and Barnes and Noble. It has also been recommended as a Washington Post Color of Money Book of the Month.

To receive Joe’s exclusive stock, option and ETF recommendations, in your mailbox every week visit https://joeduarteinthemoneyoptions.com/secure/order_email.asp.

Source link

#Santa #Warming #Sled #Whats #Watch #Fed #Bond #Market

‘The high for equities is not in,’ says technical strategist who unpacks the stocks to buy now.

Siegel argues that bonds, which have been giving stocks the shove, have proven to be a terrible inflation hedge, but investors have forgotten that given it’s 40 years since the last big price shock. “Stocks are excellent long-term hedges, stocks do beautifully against inflation, bonds do not,” he told CNBC on Tuesday.

Don’t miss: ‘Bond math’ shows traders bold enough to bet on Treasurys could reap dazzling returns with little risk

Other stock cheerleaders out there are counting on a fourth-quarter rally, which, according to LPL Financial, delivers on average a 4.2% gain as portfolio managers snap up stock winners to spiff up performances.

Our call of the day from Evercore ISI’s head of technical strategy, Rich Ross, is in the bull camp as he declares the “high for equities is not in,” and suggests some stocks that will set investors up nicely for that.

Ross notes November is the best month for the S&P 500
SPX,
Russell 2000
RUT
and semiconductors
SOX,
while the November to January period has seen a 6% gain on average for the Nasdaq Composite
COMP.
He says if the S&P can break out above 4,430, the next stop will be 4,630 within 2023, putting him at the bullish end of Wall Street forecasts.

In addition, even with 10-year Treasury yields back at their highs, the S&P 500 is still ahead this week and that’s a “great start” to any rally, he adds.

Evercore/Bloomberg

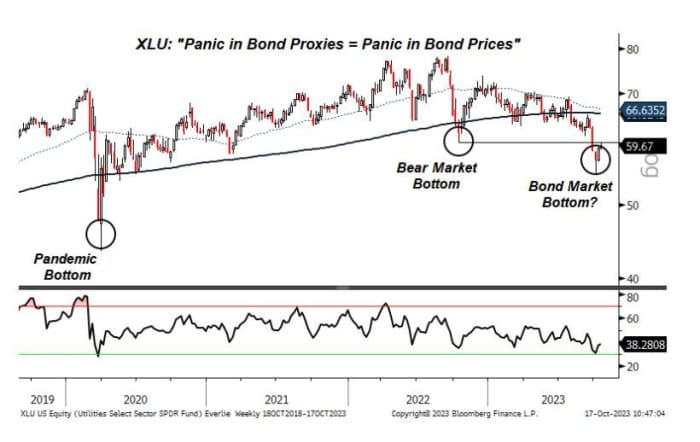
What else? He says “panic bottoms” seen in bond proxies, such as utilities via the Utilities Select Sector SPD exchange-traded fund ETF
XLU,
real-estate investment trusts and staples, are “consistent with a bottom in bond prices,” which is closer than it appears if those proxies have indeed bottomed.


Evercore/Bloomberg

Among the other green shoots, Ross sees banks bottoming following Bank of America
BAC,
+1.14%

earnings “just as they did in March of ’20 after a similar 52% decline which culminated in a year-end rally which commenced in Q4.”

He sees expanding breadth for stocks — more stocks rising than falling — adding that that’s a buy signal for the Russell 2000, retail via the SPDR S&P Retail ETF
XRT
and regional banks via the SPDR S&P Regional Banking
KRE.

The technical strategist also says it’s time to buy transports
DJT,
with airlines “at bear market lows and deeply oversold,” while railroads are also bottoming and truckers continue to rise.

As for tech, he’s a buyer of semiconductors noting they tend to gain 7% on average in November, and Nvidia
NVDA,
-2.88%

has been under pressure as of late. He also likes software such as Microsoft
MSFT,
+0.82%
,
Zscaler
ZS,
+0.66%
,
MongoDB
MDB,
+0.90%
,
Intuit
INTU,
-1.43%
,
Oracle
ORCL,
-0.05%
,
Adobe
ADBE,
+0.93%
,
CrowdStrike
CRWD,
+0.55%

and Palo Alto Networks
PANW,
+1.38%
.


Evercore/Bloomberg

“The strong tech will stay strong and the weak will get strong,” says Ross.

The markets

Stocks
SPX

COMP
are dropping, with bond yields
BX:TMUBMUSD10Y

BX:TMUBMUSD02Y
mixed. Oil prices
CL.1,
+1.82%

BRN00,
+1.69%

have pared a stronger rally after a deadly hospital explosion in Gaza City, with Iran reportedly calling for an oil embargo against Israel. Gold
GC00,
+1.84%

has shot up $35.

For more market updates plus actionable trade ideas for stocks, options and crypto, subscribe to MarketDiem by Investor’s Business Daily.

The buzz

Morgan Stanley
MS,
-6.02%

posted a 10% earnings fall, but beat forecasts, with shares down. Abbott Labs
ABT,
+3.12%

is up after upbeat results and aguidance hike and Procter & Gamble
PG,
+2.91%

is up after an earnings beat. Tesla
TSLA,
-0.89%

(preview here) and Netflix
NFLX,
-1.20%

(preview here) will report after the close.

Read: Ford CEO says Tesla, rival automakers loving the strike. He may be wrong

United Airlines shares
UAL,
-7.83%

are down 5% after the airline lowered guidance due to the Israel/Gaza war. Spirit AeroSystems
SPR,
+22.60%

surged 75% after the aircraft components maker announced a production support deal with Boeing
BA,
+0.88%
.

Housing starts came short of expectations, with the Fed’s Beige Book of economic conditions coming at 2 p.m. Also, Fed Gov. Chris Waller will speak at noon, followed by New York Fed Pres. John Williams at 12:30 p.m. and Fed Gov. Lisa Cook at 6:55 p.m.

China’s third-quarter GDP rose 4.9%, slowing from 6.3% in the previous quarter, but beating expectations.

Middle East tensions are ratcheting up with protests spreading across the region after a massive deadly blast at a Gaza City hospital, and airports evacuated across France over terror threats. President Biden told Israeli Prime Minister Benjamin Netanyahu that “it appears as though it was done by the other team.”

Read: Treasury says Hamas leaders ‘live in luxury’ as it unveils new sanctions

Best of the web

Bridgewater says the market has entered the second stage of tightening

Why the FDA needs to halt Cassava Sciences’ Alzheimer’s clinical trials

Hail, heat, rot in Italy push France to top global winemaking spot

Attacks across Europe put Islamist extremism back in spotlight

The tickers

These were the top-searched tickers on MarketWatch as of 6 a.m.:

Ticker

Security name

TSLA,
-0.89%
Tesla

AMC,
-0.73%
AMC Entertainment

AAPL,
-0.39%
Apple

GME,
-1.20%
GameStop

NIO,
-2.99%
Nio

AMZN,
-1.10%
Amazon

PLTR,
-0.59%
Palantir

MULN,
-0.06%
Mullen Automotive

TPST,
-11.20%
Tempest Therapeutics

TTOO,
-8.20%
T2 Biosystems

Random reads

Loudest purr in the world. Congrats Bella the cat.

Asteroid sample offers window to ancient solar system

Need to Know starts early and is updated until the opening bell, but sign up here to get it delivered once to your email box. The emailed version will be sent out at about 7:30 a.m. Eastern.

Listen to the Best New Ideas in Money podcast with MarketWatch financial columnist James Rogers and economist Stephanie Kelton.

Source link

#high #equities #technical #strategist #unpacks #stocks #buy

Follow the Smart Money; Technology and Homebuilder Stocks Loved Last Week’s Reversal in Bond Yields

The fear on Wall Street is rising to a fever pitch, as put option buyers recently accelerated their bets against the market while sentiment surveys reached levels of bearishness not seen since last October. As I’ve noted recently, fear is often the prelude to a tradable bounce. When fear runs high, it pays to follow the smart money, which is starting to flow back into stocks.

Fear is Reaching Extreme Levels

With so much fear among investors, stocks have now entered a familiar type of uncomfortable period; specifically, the type where even though the market is oversold, investors continue to fret and sell stocks in panic, as worries of higher interest rates continue to rise. The CBOE Put/Call ratio reading of 1.60 on 10/4/23 and the recent reading of 17 on the CNN Greed-Fear index are both bullish from a contrarian standpoint.

Of course, oversold markets can stay oversold for longer than anyone expects. Yet as long as the market does not make new lows, the odds of a tradable bottom building continue to rise. On the other hand, there is a light at the end of the proverbial tunnel, and that light is not an oncoming train. A sustained top and a subsequent retracement in bond yields will likely trigger a rebound in stocks.

Here’s the laundry list of worries:

  • The Fed continues to push for higher interest rates;
  • The market’s breadth has broken down; and
  • Bond yields remain near multi-year highs.

Yet that may all change rather quickly, as the market’s breadth is showing signs of recovery and bond yields are looking a bit top-heavy. Moreover, it looks as if bargain hunters are moving into two key areas of the market.  

Smart Money Sneaks into Tech Stocks

It wasn’t long ago that Wall Street realized that AI stocks had risen too far too fast, and we saw a breakdown in the entire technology sector. Yet, money is quietly moving back into many of the same stocks that broke down when the so-called “AI bubble” burst in August.

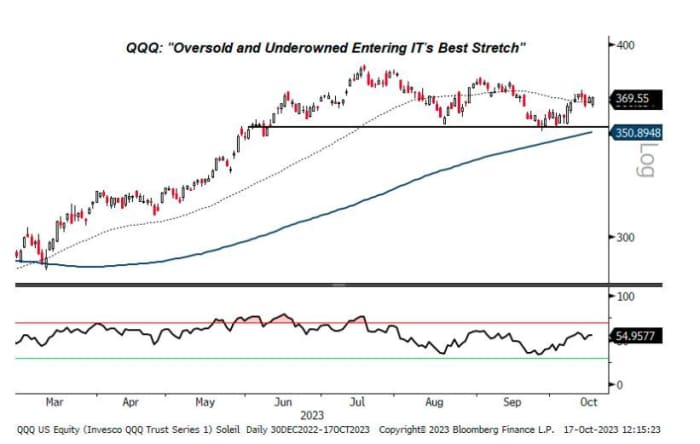
The Invesco QQQ Trust (QQQ) is heavily weighted toward a handful of large-cap tech stocks, including Microsoft (MSFT) and Alphabet (GOOGL). And while it’s still early in what could be a bumpy recovery for the market, given the Fed’s continuing talk of “higher for longer” interest rates, QQQ, which often bottoms out before the rest of the market, may have already made its lows for the current pullback. At this point, the $350 area seems to be decent support, while $370 is the key short-term resistance level. Accumulation/Distribution (ADI) and On Balance Volume (OBV) are both improving as short sellers leave (ADI) and buyers start moving in (OBV).

A perfect example of the quiet flow of smart money can be seen in shares of Alphabet, which has remained in an uptrend throughout the recent market decline and is now within reach of breaking out.

Bond Yields Are Now Totally Crazy

Much to the chagrin of regular readers, I remain fixated on the action in the bond market. That’s because, if you haven’t noticed, stocks are trading in a direct inverse lock step to bond yields. In other words, rising bond yields lead to falling stock prices and vice-versa. You can thank the robot trader farms for that.

Recently, I’ve noted the U.S. Ten Year Treasury Note (TNX) yield has been trading well above its normal trading range. Specifically, TNX has been above the upper Bollinger Band corresponding to its 200-day moving average since August 11, 2022, except for a small dip back inside the band. As I noted in my recent video on Bollinger Bands, this is a very abnormal trading pattern, which usually precedes a meaningful reversal.

Indeed, something may be happening, and we may be in the early stages of the reversal I’ve been expecting. On 10/6/23, we saw an intraday downturn in TNX after what was initially seen as a bearish jobs report delivered an early rise in yields which took TNX to 4.9%.

The above chart shows that bond yields reached a greater extreme reading recently, as TNX closed three standard deviations above its 200-day moving average on 10/2/23 and 10/6/23 (red line at top of chart), expanding the distortion in the market and likely raising the odds of bond yields reversing their recent climb. Rising bond yields have led to rising mortgage rates and weakness the homebuilder stocks, which as I recently noted to subscribers of JoeDuarteInTheMoneyOptions.com and members of my Buy Me a Coffee page here, may be poised for a rebound.

As the chart below shows, rates (MORTGAGE) have skyrocketed in what looks to be an unsustainable move.

Such a move would be expected to trip a major selloff in the homebuilder stocks. But what we saw was the opposite, as the SPDR S&P Homebuilders ETF (XHB) is starting to put in a bottom as bond yields look set to roll over.

The take-home message is that homebuilder stocks are now marching in lockstep to the tune of the bond market. Once bond yields fully reverse, the odds favor a nice move up in homebuilder stocks.

Prepare for the next phase in the market. Join the smart money at JoeDuarteInTheMoneyOptions.com where I have just added five homebuilder stocks to the model portfolios. You can have a look at my latest recommendations FREE with a two week trial subscription. For frequent updates on real estate and housing, click here.

The Market’s Breadth Shows Signs of Stabilizing

The NYSE Advance Decline line (NYAD) fell below its 200-day moving average last week, but cemented its oversold status based on its most recent RSI reading near 30. Of some comfort is that the fledgling bottom in NYAD is developing near its recent March and May bottoms.

The Nasdaq 100 Index (NDX) has survived multiple tests of the 14500-15000 support area. ADI and OBV are both bouncing, which means short covering (ADI) and buying (OBV) are occurring simultaneously.

The S&P 500 (SPX) found support just below 4250 and looks set to test the resistance levels near the 20 and 50-day moving averages in the near future. ADI is rising as short sellers cover their positions. If OBV turns up, it will be even more bullish.

VIX Remains Below 20

As it has done for the past few weeks during which the market has corrected, VIX has remained stubbornly below the 20 area. A move above 20 would be very negative.

When the VIX rises, stocks tend to fall, as rising put volume is a sign that market makers are selling stock index futures to hedge their put sales to the public. A fall in VIX is bullish, as it means less put option buying, and it eventually leads to call buying, which causes market makers to hedge by buying stock index futures. This raises the odds of higher stock prices.

Liquidity Continues to Tighten

Liquidity is tightening. The Secured Overnight Financing Rate (SOFR), is an approximate sign of the market’s liquidity. It remains near its recent high in response to the Fed’s move and the rise in bond yields. A move below 5.0 would be bullish. A move above 5.5% would signal that monetary conditions are tightening beyond the Fed’s intentions, which would be very bearish.


To get the latest information on options trading, check out Options Trading for Dummies, now in its 4th Edition—Get Your Copy Now! Now also available in Audible audiobook format!

#1 New Release on Options Trading!

Good news! I’ve made my NYAD-Complexity – Chaos chart (featured on my YD5 videos) and a few other favorites public. You can find them here.

Joe Duarte

In The Money Options


Joe Duarte is a former money manager, an active trader, and a widely recognized independent stock market analyst since 1987. He is author of eight investment books, including the best-selling Trading Options for Dummies, rated a TOP Options Book for 2018 by Benzinga.com and now in its third edition, plus The Everything Investing in Your 20s and 30s Book and six other trading books.

The Everything Investing in Your 20s and 30s Book is available at Amazon and Barnes and Noble. It has also been recommended as a Washington Post Color of Money Book of the Month.

To receive Joe’s exclusive stock, option and ETF recommendations, in your mailbox every week visit https://joeduarteinthemoneyoptions.com/secure/order_email.asp.

Source link

#Follow #Smart #Money #Technology #Homebuilder #Stocks #Loved #Weeks #Reversal #Bond #Yields

Which is More Likely — SPX Over 4600 or Below 4200?

KEY

TAKEAWAYS

  • Top investors use probabilistic analysis to think through different scenarios to determine which appears the most likely.
  • By thinking through each of four potential future paths for the S&P 500, we can be better prepared for whichever scenario actually plays out in the coming weeks.

We are now in the seasonally weakest part of the calendar year. The summer doldrums often lead to a meaningful pullback in the third quarter, and 2023 has, so far, not disappointed by following the seasonal tendencies quite well.

The month of August saw leading names like Apple (AAPL) and Microsoft (MSFT) pull back from new highs, causing many investors to rethink the “2023 is going to go up all year” thesis. So now that we’ve experienced an initial drop, what’s next for the S&P 500?

Today we’ll revisit the concept of “probabilistic analysis”, where we lay out four different potential scenarios for the S&P 500. There are three things I hope you take away from this exercise.

  1. It’s important to have a thesis as to what you think will come next for stocks. This should be based on a meaningful combination of four key pillars: fundamental, technical, macroeconomic, and behavioral. And your portfolio should be positioned to reflect what you see as the most likely outcome.
  2. It’s also important to consider alternative scenarios. What if the market is way more bullish than you’d expect? What if some five-standard-deviation event pops up, and stocks suddenly drop 20 percent? The best way to break out of your predetermined biases is to actively consider alternative points of view.
  3. It’s incredibly important to think about how you would adapt to one of those alternate scenarios. How would your portfolio perform in a risk-off environment in the coming months? Are you prepared for a sudden spike in risk assets, and at what point would you need to change your positions to match this new reality?

I have found that the most successful investors don’t know all the answers, but they ask the best questions. So let’s broaden our horizons a bit, and consider four potential future paths for the S&P 500 over the next six to eight weeks. But first, we’ll review the recent pullback for the major equity averages.

A brief seasonality check on the S&P 500 will show that August and September tend to be quite weak for the main US equity benchmark. So the drop we saw in early August actually follows the seasonal playbook quite well, as would further weakness in September.

We’ve been thinking about the possibility of a much deeper correction for risk assets, and it’s a distinct possibility that we’re now in an A-B-C pullback, which would take us to a new swing low right around options expiration in the third week of September. But at the same time that charts like LVS are displaying classic topping patterns, we can’t help but notice that stocks like Alphabet (GOOGL) appear to be firmly entrenched in a protracted bullish phase.

An uptrend is defined by a persistent pattern of higher highs and higher lows, and GOOGL certainly seems to be displaying that classic bullish phase quite well. How bearish do you want to be when Alphabet is just pounding higher month after month?

With our benchmarks pulling back and breadth conditions deteriorating, as well as key growth stocks like GOOGL still holding above support, let’s lay out four potential scenarios for the S&P 500 over the next six-to-eight weeks. And remember the point of this exercise is threefold:

  1. Consider all four potential future paths for the index, think about what would cause each scenario to unfold in terms of the macro drivers, and review what signals/patterns/indicators would confirm the scenario.
  2. Decide which scenario you feel is most likely, and why you think that’s the case. Don’t forget to drop me a comment and let me know your vote!
  3. Think about each of the four scenarios would impact your current portfolio. How would you manage risk in each case? How and when would you take action to adapt to this new reality?

Let’s start with the most optimistic scenario, involving a strong summer push for stocks.

Scenario #1: The Very Bullish Scenario

What if the pullback of the next five weeks is over, and the market goes right back to a full risk-on mode? Stocks like AAPL and MSFT would most likely return back to test new highs and interest rates would probably come down enough, as economic data continues to show at the Fed’s efforts have successfully slowed down the economy.

This Very Bullish Scenario would mean a break above 4600, and when we revisit the chart in late September, we’re talking about the possibility of new all-time highs for the S&P 500 and Nasdaq in October.

Scenario #2: The Mildly Bullish Scenario

Markets can correct in two ways: price and time. A price correction (see February 2023) involves the chart moving lower quickly as the market quickly sheds value. A time correction (see April-May 2023) means there’s not much of a price drop, and the “correction” is more of a pause of the uptrend.

There’s a possibility that the July high around 4600 still holds as resistance, and a time correction keeps the S&P 500 in the 4300-4600 range. Keep in mind that there are plenty of opportunities for sectors like Energy to thrive in a sideways market, but the major indexes don’t make any headway in either direction.

Scenario #3: The Mildly Bearish Scenario

What if the A-B-C correction outlined above plays out, and the S&P 500 index pushes lower to retest the 200-day moving average? If interest rates remain elevated, and growth stocks continue to pull back, this would be a very reasonable outcome for the equity markets.

One of my mentors used to say, “Nothing good happens below the 200-day moving average.” The good news is the Mildly Bearish Scenario means we drop further from current levels, but still manage to find support at this important long-term barometer.

Scenario #4: The Super Bearish Scenario

This is where things could get really nasty. What if the market goes full risk-off, interest rates push higher, economic data comes in hotter than expected, and the Fed is forced to consider further rate hikes instead of debating when to ease monetary conditions?

This Super Bearish Scenario would mean the S&P 500 breaks down through 4300 and 4200, leaving the 200-day moving average in the rearview mirror, and in late September we’re debating whether the S&P 500 and Nasdaq will make a new low before year-end 2023.

Have you decided which of these four potential scenarios is most likely based on your analysis? Head over to my YouTube channel and drop a comment with your vote and why you see that as the most likely outcome.

Also, we did a similar analysis back on the S&P 500 back in June. The “mildly bullish” scenario ending up matching the market action pretty closely. Which scenario did you vote for?

Only by expanding our thinking through probabilistic analysis can we be best prepared for whatever the future may hold!

RR#6,

Dave

P.S. Ready to upgrade your investment process? Check out my free behavioral investing course!


David Keller, CMT

Chief Market Strategist

StockCharts.com


Disclaimer: This blog is for educational purposes only and should not be construed as financial advice. The ideas and strategies should never be used without first assessing your own personal and financial situation, or without consulting a financial professional.

The author does not have a position in mentioned securities at the time of publication. Any opinions expressed herein are solely those of the author and do not in any way represent the views or opinions of any other person or entity.

David Keller

About the author:
David Keller, CMT is Chief Market Strategist at StockCharts.com, where he helps investors minimize behavioral biases through technical analysis. He is a frequent host on StockCharts TV, and he relates mindfulness techniques to investor decision making in his blog, The Mindful Investor.

David is also President and Chief Strategist at Sierra Alpha Research LLC, a boutique investment research firm focused on managing risk through market awareness. He combines the strengths of technical analysis, behavioral finance, and data visualization to identify investment opportunities and enrich relationships between advisors and clients.
Learn More

Source link

#SPX

Bonds Toy with Secular Bear Market — Was That the Top in Housing Stocks? Maybe Yes, Maybe No.

The market’s worsening breadth and the lack of a robust bounce on 8/18/23, even as bond yields reversed course after their runaway freight train climb during the week, is worrisome.

On the other hand, the market’s sentiment is souring rapidly, and oversold gauges are closing in on traditional bounce territory. Consider this:

  • CBOE Put/Call Ratio hit 1.25 on 8/16 – the highest reading in eight months;
  • The CNN Greed Fear Index hit 46 (neutral) on 8/18/23 – a month ago it was at 83 (extreme greed). Readings below 40 signal excessive greed in the market;
  • RSI for the S&P 500 (SPX) is at 34, just shy of the critical 30 oversold reading; and 
  • The New York Stock Exchange Advance Decline line (NYAD, see below) closed outside its lower Bollinger Band for the fourth straight day – this is as oversold as it gets.

Thus, with rising pessimism and with the market nearing an oversold level, the key to what happens next depends on what type of bounce we see in the next few days. If there is no real strength in the bounce, we may see a renewal of the downtrend.

Bonds Test Secular Bear Market Boundaries

The U.S. Ten Year Note yield (TNX) recently tested the 4.30% yield area, its highest point since late 2022, before turning lower. If TNX breaches this key chart point, bonds may have entered a secular bear market. That won’t be good for stocks.

The long-term chart for TNX shows that yields crossed a meaningful high point (3.25%) area in 2019 before re-entering a bullish phase, due to the pandemic raising the specter of a global depression.

Of course, history has shown that no such thing happened as global central banks hit the digital printing presses.

The U.S. recovered. The jury is still out for Europe. China remained closed too long. Foreign companies moved. Since China’s economy depends on foreign capital to fuel its manufacturing base, the exit of foreign companies resulted in a capital vacuum which is now affecting the Chinese property sector, as seen in the recent bankruptcy of the Evergrande Real Estate conglomerate, China’s largest developer.

Normally, this would be bullish news for U.S. Treasuries. Is this time different?

So Why are Bond Yields Rising?

The pandemic reversed globalization, as lockdowns had unintended consequences. Consider the following:

  • Companies moved out of China, taking capital out of the Chinese economy;
  • Construction of manufacturing plants and warehouses in the U.S. has increased; while
  • Supply chains have not fully adjusted.

New factories built in the U.S. are technology-focused: semiconductors, solar power technology, and electric car parts and batteries. A few factories make building materials, household appliances, furniture, cell phones, or internal combustion engine automobiles.

Ignored are food processing, medical product manufacturing, and other important areas. Normally, these items come from China. But China’s economy is slowing, and capital flight is making operations there difficult for both domestic and foreign companies, creating shortages of everyday products and raising prices. 

In the U.S., the skilled labor pool has shrunk. There aren’t enough people farming, making furniture, or processing meat. Those with those skills cost more. Meanwhile, companies looking to build factories in the U.S. are having trouble finding enough skilled construction workers, adding to rising costs and fueling inflation.

The U.S. government continues to pump money into the clean energy economy, flooding the economy with money just as the Fed is trying to tighten conditions. Too many dollars chasing too few goods – the most basic definition of inflation. Capital allocation is unbalanced and inefficient, compounding the problem. Thus, bond traders fear a squeeze in raw materials and skilled labor costs, and the related decreased production of necessary household goods.

In other words, the post-pandemic period is turning into one where inflation is becoming structural. If TNX moves above 4.3%, this notion will be all but confirmed.

Smart Money Update: Was that the Top in Housing Stocks?

We may have seen the top in the housing stocks, although the jury is still out on this. I’ve been bullish on homebuilders for quite a long time, but, unless something improves quickly, the best days for this group may be behind us.

The SPDR S&P Homebuilder crashed and burned on 8/17/23, slicing through its 50-day moving average like butter. Moreover, there was no real bounce to speak of on the next day, which is what’s usually happened in the past twelve months after heavy bouts of selling. Accumulation/Distribution (ADI) and On Balance Volume (OBV) both rolled over aggressively, both negative signs suggesting money is moving out in a hurry.

The key is if and how the sector bounces back. Still, the supply shortages in the housing market will resurface as the kindling required to reignite a rally in XHB. Meanwhile, money is decidedly finding a home in the energy sector, specifically in oil and oil service stocks (OIH).

Patient investors may eventually benefit from the uranium market, as nuclear power continues to slowly become a viable alternative in the search for clean energy sources in the face of the cuts in oil and natural gas production, as displayed in the accelerating downward path of the weekly oil rig count. There are now 136 fewer active rigs in the U.S. compared to the same period in 2022.

A sector, which is bullishly being ignored by many traders, is uranium. But the shares of the Global X Uranium ETF (URA) are under steady accumulation. I recently discussed how to spot the smart money’s footprints and how to turn them into profits. URA, in which I own shares, is featured in the video. You can get the full details here.

Do you own homebuilder stocks? What should you do with your energy holdings? Get answers at Joe Duarte in the Money Options.com. You can have a look at my latest recommendations FREE with a two-week trial subscription. And for an in-depth review of the current situation in the oil market, homebuilders and REITS, click here.

Will NYAD Finally Bounce? NDX and SPX Approach Oversold Levels

Given the drubbing stocks took last week and the oversold reading on RSI for the New York Stock Exchange Advance Decline line, you’d think we’d get a bigger bounce when bond yields turned lower on Friday. No such thing happened. That’s worrisome.

The long term trend for stocks remains up, but the short- and intermediate-term trends are in question, as NYAD remained below its 20-day and 50-day moving averages and may still be headed for a test of its 50-day, and perhaps the 200-day, moving average.

The Nasdaq 100 Index (NDX) is very oversold after breaking below its 50-day moving average the 15,000 level. Accumulation/Distribution (ADI) and On Balance Volume (OBV), remain weak, as short sellers are active and sellers are overtaking buyers. Let’s see what type of bounce we get.

The S&P 500 (SPX) looks just as bad, remaining below 4500, its 20-day and its 50-day moving averages. Both ADI and OBV are negative. Support is now around the 4300 area.

VIX Remains Below 20

VIX rolled over at the end of last week without taking out the 20 level. This is good news. A move above 20 would be very negative as it would signal that the big money is finally throwing in the towel on the uptrend. 

When the VIX rises, stocks tend to fall, as rising put volume is a sign that market makers are selling stock index futures to hedge their put sales to the public. A fall in VIX is bullish, as it means less put option buying, and it eventually leads to call buying, which causes market makers to hedge by buying stock index futures. This raises the odds of higher stock prices.

Liquidity Remains Stable

Liquidity is stable, but may not remain so for long if the current fall in stock prices accelerates. The Secured Overnight Financing Rate (SOFR), which recently replaced the Eurodollar Index (XED) but is an approximate sign of the market’s liquidity, just broke to a new high in response to the Fed’s move. A move below 5.0 would be more bullish. A move above 5.5% would signal that monetary conditions are tightening beyond the Fed’s intentions. That would be very bearish.


To get the latest information on options trading, check out Options Trading for Dummies, now in its 4th Edition—Get Your Copy Now! Now also available in Audible audiobook format!

#1 New Release on Options Trading!

Good news! I’ve made my NYAD-Complexity – Chaos chart (featured on my YD5 videos) and a few other favorites public. You can find them here.

Joe Duarte

In The Money Options


Joe Duarte is a former money manager, an active trader, and a widely recognized independent stock market analyst since 1987. He is author of eight investment books, including the best-selling Trading Options for Dummies, rated a TOP Options Book for 2018 by Benzinga.com and now in its third edition, plus The Everything Investing in Your 20s and 30s Book and six other trading books.

The Everything Investing in Your 20s and 30s Book is available at Amazon and Barnes and Noble. It has also been recommended as a Washington Post Color of Money Book of the Month.

To receive Joe’s exclusive stock, option and ETF recommendations, in your mailbox every week visit https://joeduarteinthemoneyoptions.com/secure/order_email.asp.

Source link

#Bonds #Toy #Secular #Bear #Market #Top #Housing #Stocks

The Smart Money Changes Gears; As Tech Weakens, New Leaders Appear

The Fed is flying trial balloons about the end of the interest rate hike cycle, but the technology sector is ignoring them as the smart money move to energy continues.

Last week, Philadelphia Fed Governor Patrick Harker, in a Philadelphia speech, suggested the central banks should pause their rate hikes. Moreover, even though the CPI inflation numbers were relatively tame, markets seemed to focus on the more negative details inside the report, such as persistently high rents and car insurance prices.

Interestingly, producer prices (PPI) rose as well, but much of the climb was due to an increase in fees by money managers – hardly a widespread expense as compared to gasoline and food. Meanwhile, consumer confidence is flat and inflation expectations are improving.

Still, money flows in bonds and stocks suggest otherwise. That’s not a good turn of events, if not reversed, especially when the Fed is trying to gauge the market’s response to a potential extended pause on its rate hikes.

As Tech Weakens, New Leaders Appear

Last week in this space, I noted “short sellers are starting to smell blood in the water in the tech sector.” This week, the evidence piled up further as the bloom is wearing off the AI rose, at least for now. You can see that sellers have gained the upper hand as the Invesco QQQ Trust (QQQ) has broken below its 50-day moving average, as both Accumulation/Distribution (ADI, increasing short sales) and On Balance Volume (OBV, buyers turning into sellers) have also rolled lower.

But QQQ is not alone. A more focused picture of the selling in AI and robotics-related stocks can be seen in the shares of the ROBO Global Robotics and Automation ETF (ROBO), which has fallen back to what may be long-term support near $54. If ROBO fails to hold in this general area, which features two very large Volume-by-Price bars (VBP) and the 200-day moving average as key markers, the decline will likely accelerate.

A stark example of how rising costs are impacting emerging technology companies was the collapse of solar tech company Maxeon Solar Technologies (MAXN), whose shares cratered after the company missed its earnings estimates and lowered forward guidance, citing “falling demand” for its products while partially blaming the situation on higher interest rates.

Meanwhile, shares of energy stocks, such as refiner Valero Energy (VLO), continue to power higher as the fuel supply and demand balance is steadily tipping toward the energy patch. This view is supported by the steady downward pace in the weekly oil rig count. There are now 125 fewer active rigs in the U.S. compared to the same period in 2022.

VLO is emerging above a stout resistance shelf, marked by a large cluster of Volume-by-Price (VBP) bars extending back to the $107 area. A move above $140 would likely lead to higher prices in a hurry. I recently discussed how to spot the smart money’s footprints and how to turn them into profits; you can check out the video here.

Over the last few weeks, I’ve asked whether it’s time to sell the tech rally. What should you do with your energy holdings? And what about the homebuilder stocks and the REITs? The answers are in the model portfolios at Joe Duarte in the Money Options.com, updated weekly, and via Flash Alerts as needed. You can have a look at all of them and my latest recommendations on what to do with each individual pick FREE with a two week trial subscription. And, for an in-depth review of the current situation in the oil market, homebuilders and REITS, click here.

Bonds, Oil, and Stealth Inflation

The lack of enthusiasm from bond traders about the CPI numbers, quirky PPI numbers and a Fed governor suggesting the central bank may stop raising rates soon suggests there is more going on than meets the eye. The answer may be future inflation related to limited supplies of products and services, which are not likely to increase anytime soon, along with the unknowns about the future of global energy prices.

The U.S. Ten-Year Note yield (TNX) briefly dipped below 4% on the CPI news. But the rally didn’t last. And by week’s end, yields were once again moving toward the higher end of the trading range, which has been in place since October 2022.

More concerning is the lack of interest from bond traders regarding deflationary news from China a day earlier, which suggests the bond market is not a believer in the notion that inflation is slowing to the point where the Fed can stop raising rates.

In the present, you can blame their disbelief on the oil market, where volatile supply data and demand news, combined with ongoing reports that U.S. oil production is being curtailed, is moving prices higher.

Moreover, as evidenced by the action in MAXN, above, it’s becoming evident that the ongoing transfer from traditional energy to renewable energy will be more expensive than initially thought. All of which suggests that inflation is becoming stealthily embedded into the system. When you factor in the expected rise in U.S. Treasury bond issuance by the U.S. Treasury and the increasing budget deficits, the indifference from bond traders makes sense.

In other words, even though CPI may have slowed its gains for now, the bottoming of PPI may be a prelude to the near future. Thus, forward-looking bond traders may be considering future shortages of key minerals, the energy to fuel the transition to clean energy, and tight labor.

Specifically, along with poor demand for solar technology, the bond market may be quietly worried about the ongoing problems in the wind energy industry, where costs are reportedly out of control, to the tune of having climbed 20-40% since February 2022. Meanwhile, reports of major technical problems with turbines continue to plague the industry, while governments are beginning to evaluate how much more money they’re willing to put into subsidies.

NYAD Struggles, Major Indexes Extend Losses

The long-term trend for stocks remains up, but the short term is weakening further. The New York Stock Exchange Advance Decline line (NYAD), has broken below its 20-day moving average and may be headed for a test of its 50-day, and perhaps the 200-day, moving averages.

The Nasdaq 100 Index (NDX) has broken below its 50-day moving average and looks headed for a test of the 15,000 level. Accumulation/Distribution (ADI) and On Balance Volume (OBV), remain weak, as short sellers are active and sellers are overtaking buyers.

The S&P 500 (SPX) remained below 4500, and its 20-day moving average, as it approaches a test of its 50-day moving average. Both ADI and OBV are nowhere near uptrends. Support is now around the 4400 area.

VIX Struggles at 20

I’ve been expecting a move higher in VIX, and it seems to have arrived as the index finally moved above the key 15 resistance level. The good news is that the index has yet to break above 20. A move above 20 would be very negative, as it would signal that the big money is finally throwing in the towel on the uptrend.

When the VIX rises, stocks tend to fall, as rising put volume is a sign that market makers are selling stock index futures to hedge their put sales to the public. A fall in VIX is bullish, as it means less put option buying, and it eventually leads to call buying, which causes market makers to hedge by buying stock index futures. This raises the odds of higher stock prices.

Liquidity Remains Stable

Liquidity is stable, but may not remain so for long if the current fall in stock prices accelerates. The Secured Overnight Financing Rate (SOFR), which recently replaced the Eurodollar Index (XED), but is an approximate sign of the market’s liquidity, just broke to a new high in response to the Fed’s move. A move below 5.0 would be more bullish. A move above 5.5% would signal that monetary conditions are tightening beyond the Fed’s intentions. That would be very bearish.


To get the latest information on options trading, check out Options Trading for Dummies, now in its 4th Edition—Get Your Copy Now! Now also available in Audible audiobook format!

#1 New Release on Options Trading!

Good news! I’ve made my NYAD-Complexity – Chaos chart (featured on my YD5 videos) and a few other favorites public. You can find them here.

Joe Duarte

In The Money Options


Joe Duarte is a former money manager, an active trader, and a widely recognized independent stock market analyst since 1987. He is author of eight investment books, including the best-selling Trading Options for Dummies, rated a TOP Options Book for 2018 by Benzinga.com and now in its third edition, plus The Everything Investing in Your 20s and 30s Book and six other trading books.

The Everything Investing in Your 20s and 30s Book is available at Amazon and Barnes and Noble. It has also been recommended as a Washington Post Color of Money Book of the Month.

To receive Joe’s exclusive stock, option and ETF recommendations, in your mailbox every week visit https://joeduarteinthemoneyoptions.com/secure/order_email.asp.

Source link

#Smart #Money #Gears #Tech #Weakens #Leaders

These stocks could be the next Magnificent Seven market leaders, says Goldman Sachs.

The second half of the year kicks off with a holiday-shortened week, though jobs data comes at the end of it. That’s as Tesla may have lit a firecracker for tech with some pretty bullish sales numbers out Sunday.

“Can tech keep up the pace?” is a burning question for many with regards to a sector that helped drive the S&P 500
SPX,
+1.23%

to its best first half since 2019. On the plus side, history dictates that one good half can lead to another, though some worry too much investor exuberance could spoil things.

So naturally, another obvious question looking ahead is how to find outperformers like the so-called “Magnificent Seven” tech names that led the first half — Amazon
AMZN,
+1.92%
,
Microsoft
MSFT,
+1.64%
,
Alphabet
GOOGL,
+0.50%
,
Meta
META,
+1.94%
,
Tesla
TSLA,
+1.66%

and Nvidia
NVDA,
+3.63%
.

Our call of the day, from a team at Goldman Sachs led by chief U.S. equity strategist David Kostin, offers up some ideas on that front and spoiler, Tesla is among them.

To find the new names, Goldman spiffed up its “Rule of 10” stock screen that pinpoints companies with realized and future sales growth greater than 10% for 2021 to 2025. They note that strong sales growth has been a common thread running through each of those names, as each have grown sales at a faster rate than the broader index since 2010, except 2022.

“The largest tech stocks in the U.S. equity market make it clear that identifying firms capable of posting sustained 10%+ sales growth in their nascent stages can be rewarding for investors. Rapid and consistent sales growth was a common attribute of today’s largest stocks as they ascended the index ranks,” said Kostin and the team.

Roughly 20 names meet this criteria and among them is one of those big tech outperformers — Tesla. Salesforce
CRM,
+0.39%

has consistently made the cut, said Goldman. The top 10 names on this list are Enphase Energy
ENPH,
+5.49%
,
Tesla, SolarEdge
SEDG,
+5.94%
,
Palo Alto Networks
PANW,
+0.86%
,
ServiceNow
NOW,
+2.53%
,
Paycom Software
PAYC,
+2.41%
,
Fortinet
FTNT,
+0.67%
,
DexCom
DXCM,
+0.45%

and Insulet
PODD,
-0.91%
.

Goldman also presented a screener for stocks based on net income growth. Those must have more than 10% per year net income growth for the 2021 to 2025 period.

Currently 18 names fit this criteria and are trading at below average premiums to the S&P on a price/earnings and price to earnings growth ratio, they say. The top 10 are Baker Hughes
BKR,
+0.80%
,
Match Group
MTCH,
-0.07%
,
Insulet , Aptiv, Bookings Holdings
BKNG,
+1.67%
,
ServiceNow, Schlumberger
SLB,
+1.34%
,
Chipotle
CMG,
+1.35%
,
Paycom and Halliburton
HAL,
-0.60%
.

And eight companies are on both lists: Paycom, Fortinet, Insulet, Salesforce, Intuit, Cadence Design Systems
CDNS,
+2.62%

and Aptiv.

As an aside, Kostin and the team address the whole narrow market issue, saying that in any given year, returns have been concentrated on a group of outperformers. Observe the below chart:

“Excluding the top 10 contributors in each year, the S&P 500 would have delivered an 8% average annual return since 1990 (vs. 12% for the full index),” they said. The top 10 contributors account for roughly 12 percentage points of the S&P 500’s 15% year-to-date return.

The market

It will be a shortened session for Wall Street ahead of Tuesday’s 4th of July holiday. Ahead of that, equity futures
ES00,
-0.06%

YM00,
-0.18%

are mostly lower, except for tech
NQ00,
+0.02%
,
thanks to Tesla, while bond yields
TMUBMUSD10Y,
3.856%

were mildly mixed. Oil prices
CL.1,
+1.12%

got a lift after Saudi Arabia and Russia said they would extend oil production cuts into August. Asia had a strong session, led by a 1.7% gain for the Hang Seng
HSI,
+2.06%
.

For more market updates plus actionable trade ideas for stocks, options and crypto, subscribe to MarketDiem by Investor’s Business Daily.

The buzz

Tesla
TSLA,
+1.66%

delivered 466,140 vehicles in the second quarter, surpassing estimates as the EV maker boosted dividends and incentives. That should “beat the bears back into hibernation,” says Wedbush analyst Dan Ives. Indeed, the stock is up over 6% in premarket trading.

Upbeat delivery data has also lifted shares of XPeng
XPEV,
+13.44%

and Nio
NIO,
+3.19%
,
by 10% and 6%, respectively.

Shares of Fidelity National Information Services
FIS,
+3.36%

also surged 6% after a report late last week cited private-equity interest in buying a possible majority stake in the company’s Worldpay business. 

Apple
AAPL,
+2.31%

has reportedly slashed its production targets for its pricey Vision Pro headset, as components makers are struggling with its complicated design. The report comes as Apple closed above a $3 trillion valuation on Friday.

A holiday shortened week will finish with the June jobs report on Friday. The week begins with the S&P U.S. manufacturing purchasing managers index at 9:45 a.m., followed by the Institute for Supply Management’s manufacturing index at 10 a.m. and construction spending on Monday. Other highlights include minutes of the Fed’s June meeting on Wednesday and the ISM services index on Thursday.

A private gauge for China’s factory activity showed slightly lower activity in June.

It was a lukewarm weekending opening for Walt Disney
DIS,
+0.37%

and Lucasfilm’s “Indiana Jones and the Dial of Destiny.”

The grandmother of a slain French teen has pleaded for calm after a fifth night of riots in France. The government says social media has fueled the unrest.

Best of the web

These are your options if you can’t pay back your student loans when payments start up again.

Leveraged-loan logjam eases after banks unload tens of billions of debt.

Carmakers are getting into the mining business.

The chart

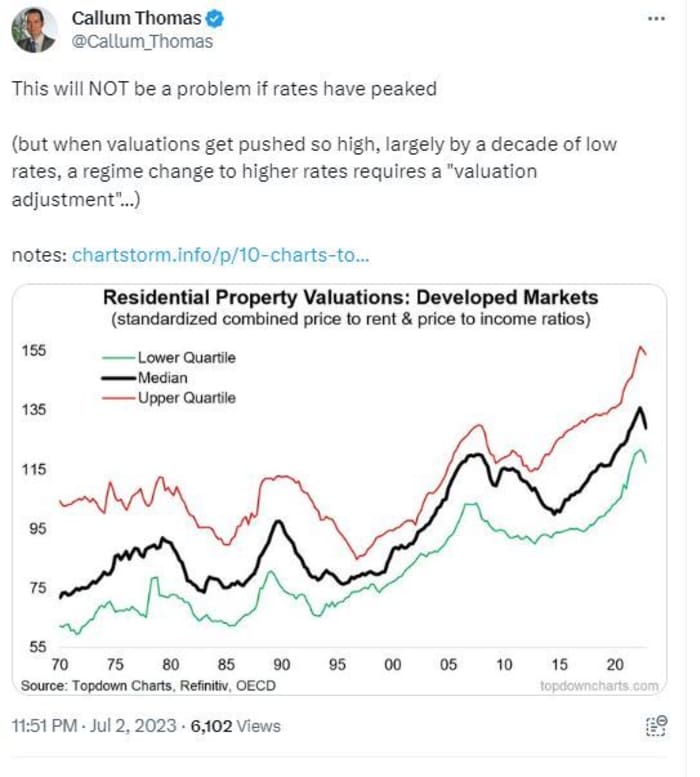
Here’s a chart from head of @topdowncharts, Callum Thomas, looking at some residential property values that are starting to roll over a bit:


@callum_thomas

Top tickers

These were the top-searched tickers on MarketWatch as of 6 a.m.:

Ticker

Security name

TSLA,
+1.66%
Tesla

NIO,
+3.19%
Nio

AAPL,
+2.31%
Apple

NVDA,
+3.63%
Nvidia

GME,
-2.61%
GameStop

MULN,
-7.16%
Mullen Automotive

AMC,
-0.45%
AMC Entertainment

AMZN,
+1.92%
Amazon.com

PLTR,
+0.86%
Palantir Technologies

TOP,
+20.38%
TOP Financial Group

Random reads

It’s no joke. Elon Musk and Mark Zuckerberg may really get in a cage and fight.

Fed up with the U.K., the Orkey Islands want to be part of Norway.

Need to Know starts early and is updated until the opening bell, but sign up here to get it delivered once to your email box. The emailed version will be sent out at about 7:30 a.m. Eastern.

Listen to the Best New Ideas in Money podcast with MarketWatch reporter Charles Passy and economist Stephanie Kelton.

Source link

#stocks #Magnificent #market #leaders #Goldman #Sachs

Bullish Tidings: Breadth Rallies, Oil Service Makes its Move, Bonds Survive Yield Scare

Three weeks before the Fed’s next meeting, investors who have missed the AI/tech rally have thrown caution to the wind.

That urgency to catch up has led to an encouraging improvement in the market’s breadth and a marginal new high in the S&P 500 index ($SPX). The combination is likely setting the market up for what could be an impressive upward thrust. See below for full details.

And if June is any sign of what July may be, the bulls will rule the roost. Here are some grounding facts:

  • The S&P 500 index has returned an average of 3.3% in July from 2012–2022.
  • SPX rallied 9% in July 2022.

Of course, there are no guarantees that history will repeat itself. But it pays to be always ready. So, which sectors are likely to benefit? I have some thoughts just below.

Bond Yields Survive Yield Scare

I wouldn’t be surprised if the Fed joined the other global central banks that have raised interest rates in the last few weeks. However, from a trading standpoint, the action in bonds is more important, as bond yields have largely disagreed with the Fed’s perception of the economy since late 2022.

What I mean, of course, is that even as the Fed raised interest rates after October 2022, bond yields have fallen since then, setting up a divergence.

Certainly, there has been some volatility in yields. For example, the 10-Year US Treasury Yield Index ($TNX) bounced higher on June 29, 2023, as a surprising upward revision of US GDP to the 2% growth rate raised the odds of a rate hike at the upcoming FMOC meeting in mid-July. Yet, the flattening out of the Fed’s favorite indicator, the PCE inflation gauge on June 20, 2023, calmed things down.

That leaves the resistance band between 3.6–3.85% as the area to monitor. If TNX rises above 3.85%, we may see a move toward 4%, which would be very negative for stocks, especially the interest rate-sensitive homebuilders and real estate investment trusts (REITs).

The Fine Print in Housing Stats: Supply, Supply, Supply

As would be expected, as TNX flirted with 3.85%, there was a pullback in the homebuilder stocks. But as we’ve learned over the recent past, the correlation between the direction of bond yields and the action in the homebuilder stocks is nearly 100%. As a result, when bond yields, as I described above, hit resistance at 3.85% and turned lower, the homebuilder stocks regained their upward trend.  

Overall, the housing sector continues to deliver mixed news. For example:

  • New home sales recently rose—bullish for homebuilders.
  • Existing home sales are flattening out—neutral for brokers.
  • Pending home sales fell—not what you may be thinking.

The quiet part is all three stats above have two things in common—low supply and steady-to-rising demand. So new home sales are rising because builders are building enough of them to sell to enough people who are looking for housing. Existing home sales are flat because no one wants to sell a house with a 3% mortgage and buy a new one with a 6% mortgage. And, of course, if no one wants to sell their house, then you get a fall in pending home sales.

The bottom line remains unchanged. Low supply of steady demand favors the homebuilders.

Overall pending home sales fell 2.7% month to month. And if you’re wondering how each U.S. region fared in the pending home sales data here you go:

  • The Northeast delivered a 12.9% increase.
  • The South registered a 4.4% decrease.
  • The Midwest dropped by 5.3%.
  • The West’s sales dropped by 6.1% (a 62% decrease since 2001).

Moreover, the National Association of Realtors noted that there are still three pending offers per sale.

Mortgage rates ticked up last week, along with bond yields. Homebuilder stocks pulled back slightly before recovering. Several homebuilders will be reporting earnings in July, near the date of the Fed’s next meeting.

For an in-depth look at the news and trends in the housing and real estate market, check out my new publication, Joe Duarte’s Real Estate Weekly, here.  You’ll find crucial and detailed real estate market updates in an easy-to-follow and highly accessible format. This crucial information complements the stock picks at Joe Duarte in the Money Options.com. For more details on how to trade the bullish housing megatrend, check out my latest video here.

Oil Service Makes its Move

The bullish action in stocks on June 30 might be at least partially related to window dressing. That’s where portfolio managers who missed the rally play catch up to show their clients that they own stocks in groups that are rising. That means that the bullish action may or may not remain in some of the more extended market sectors, such as AI.

On the other hand, some portfolio managers use the cover of window dressing as a stealthy way to put money to work in sectors that offer value. As a result, while everyone is looking at the hot sectors, such as AI, it pays to look at sectors that have underperformed in the first half.

One of them is oil service. As the price chart illustrates, the Philadelphia Oil Service Index (OSX) shows some bullish characteristics. Note the broaching of the 200-day moving average after the recent double bottom it carved out over the last three months.

Moreover, its accompanying ETF, the Van Eck Vectors Oil Service ETF (OIH), looks even better. You can see that OIH has crossed above its 200-day moving average, marking what looks to be the start of a bullish reversal.

In addition, you can see that the Accumulation Distribution Line has begun to move higher as the On Balance Volume (OBV) indicator has bottomed out. Together, these two indicators confirm the emerging price trend in OIH as money moves in.

I have several oil service stocks in my Joe Duarte in the Money Options portfolios which are worth considering. One of them just broke out to a new high. You can check it out with a FREE trial to my service here.

NYAD Recovers and Gathers Upside Momentum

In a bullish development, the New York Stock Exchange Advance Decline line ($NYAD) turned on a dime last week and moved decidedly higher, breaking above short-term resistance. This comes after a short-lived dip below the 50-day moving average.

The Nasdaq 100 Index ($NDX) also turned around, finding support at its 20-day moving average. ADI and OBV have turned short-term negative.

The S&P 500 made a new high since the October bottom in stocks. As with NDX, SPX found support at its 20-day moving average. This is a bullish development. Both ADI and OBV stabilized.

VIX Is Likely to Bounce

After its recent new lows, the Cboe Volatility Index ($VIX) is poised to rise, as July often marks a bottom. On the other hand, VIX is at such a low level that it could take a while before the negative effects of a rising VIX affect the bullish action in stocks.

When the VIX rises, stocks tend to fall, as rising put volume is a sign that market makers are selling stock index futures to hedge their put sales to the public. A fall in VIX is bullish, as it means less put option buying, and it eventually leads to call buying, which causes market makers to hedge by buying stock index futures. This raises the odds of higher stock prices.


To get the latest information on options trading, check out Options Trading for Dummies, now in its 4th Edition—Get Your Copy Now! Now also available in Audible audiobook format!

#1 New Release on Options Trading!

Good news! I’ve made my NYAD-Complexity – Chaos chart (featured on my YD5 videos) and a few other favorites public. You can find them here.

Joe Duarte

In The Money Options


Joe Duarte is a former money manager, an active trader, and a widely recognized independent stock market analyst since 1987. He is author of eight investment books, including the best-selling Trading Options for Dummies, rated a TOP Options Book for 2018 by Benzinga.com and now in its third edition, plus The Everything Investing in Your 20s and 30s Book and six other trading books.

The Everything Investing in Your 20s and 30s Book is available at Amazon and Barnes and Noble. It has also been recommended as a Washington Post Color of Money Book of the Month.

To receive Joe’s exclusive stock, option and ETF recommendations, in your mailbox every week visit https://joeduarteinthemoneyoptions.com/secure/order_email.asp.

Source link

#Bullish #Tidings #Breadth #Rallies #Oil #Service #Move #Bonds #Survive #Yield #Scare

Here’s what Wall Street’s most bullish analyst heading into the year thinks of the stock market now

It’s back to business on Monday, but there’s a bit of nervousness after the near coup/rebellion/cage fight in one of the world’s biggest nuclear powers over the weekend.

Questions remain over a possible power struggle in Russia, as it continues to wage war on Ukraine. But barring bigger developments, investors are returning their focus on whether aggressive central banks will spark a recession and market fallout.

Read: What’s next for markets after aborted Wagner mutiny leaves Russia’s Putin weakened

Wall Street has been growing more bullish after entering 2023 in a fearful state, following the S&P 500’s
SPX,
-0.77%

worst year since 2008. One analyst who led bullish views headed into 2023 was Deutsche Bank’s chief U.S. equity and global strategist, Binky Chadha, who sees a 4,500 finish, and others have been playing catch up to him.

In our call of the day, Chadha spoke to MarketWatch about why he’s not budging from that bullish call and what, if anything, could derail his optimistic view.

He said the year has been playing out as the bank had forecasted — strong rallies led by a squeeze on markets due to underweight positioning, with tech in the driver’s seat — the Nasdaq
COMP,
-1.01%

is up 16% so far this year. The path higher will be more of a grind as some of that positioning has caught up, he says.

Investors underweight in equities from late last year have largely caught up with their exposure, while others stay wary, says Deutsche Bank’s Binky Chadha.


Deutsche Bank

Read: Why the ‘easy money’ has been made in the stock-market rally — and what comes next

Chadha said he’d rethink his more bullish outlook on “signs of corporate risk aversion. Companies pulling back and going back into the bunker.” That is corporates becoming risk averse, cutting working capital, hoarding cash, and paring capital expenditure, he said. For now, he doesn’t see that.

The strategist also weighed in on narrow market leadership, where S&P 500 gains are led by just a handful of names. “Keep in mind that the selloff of last year was also narrow,” he said, when energy stocks soared on higher prices.

But this year the reversal has seen techs rally and now he sees indeed the gains spreading to more names. He said the bank recently removed its overweight on mega-tech stocks because earnings are rebounding, but markets have priced in a lot more than they expect.

As for where to put money now? “I wouldn’t be long financials here. The events of March have painted financials with a very broad brush. Most of the large -cap financials are really beneficiaries of what happened in March, but the market has put a risk premium on them,” said Chadha

As for cyclical consumer stocks, the risk/reward is asymmetrical because so much is priced in for the downside. “Everybody in the market has been waiting so long for the recession and some things are priced for even more than an average recession,” he said.

“And so I think you want to be long the cyclical parts of the consumer, and I think you want to be underweight defensives, because rates stay here and that’s where everybody has been hiding,” he said.

And what would make Chadha lift that 4,500 S&P 500 target? “Better prospects for the economy, better prospects for gorwth. In the event of a soft landing, and to be clear that is not our house view, but that would not be a terrible thing.” And that would eventually lead to upside for markets, he said.

The markets

Stock futures
ES00,

YM00,
+0.01%

are marginally lower, with Treasury yields
TMUBMUSD10Y,
3.691%

and oil prices
CL.1,
+0.48%

dipping, and silver
SI00,
+1.97%

making some strides. Lots of weakness across Asia, led by the Shanghai Composite
SHCOMP,
-1.48%
,
while Europe stocks
SXXP,
-0.07%

are lower after a newsy Russia weekend, and natural gas futures
NG00,
+1.17%

are higher both in the U.S. and Europe. The ruble
USDRUB,
+0.91%

is down 1.7% against the dollar
DXY,
-0.27%
,
which is a little softer overall.

For more market updates plus actionable trade ideas for stocks, options and crypto, subscribe to MarketDiem by Investor’s Business Daily.

The buzz

Goldman Sachs became the third Wall Street bank in a week to downgrade Tesla shares
TSLA,
-3.03%

to neutral, saying the stock has had a strong runup and competition grows for the EV maker. The stock is down 2% in premarket.

PacWest shares
PACW,
+0.56%

are up 8% after the regional bank said it sold its loan portfolio to Ares Management
ARES,
-2.37%

in deal that will generates $2 billion ‘to improve liquidity.’

Lucid
LCID,
-4.54%

stock is up 7% after the EV and battery pack maker agreed a deal to provide Aston Martin with powertrain and battery system technology for luxury EVs.

IBM
IBM,
-1.33%

has confirmed a $4.6 billion all-cash deal for privately held software group Appio. IBM shares are down slightly.

The Fed’s preferred inflation gauge — the personal consumption expenditures price index — is a big economic highlight, due Friday. Durable goods and some housing market data is coming Tuesday, with appearances by Fed Chairman Jerome Powell on Wednesday and Thursday.

German business sentiment fell in June Fell in June as the country’s manufacturing outlook worsened.

Russia’s defense minister Sergei Shoigu was spotted visiting troops in Ukraine on Monday — his first public appearance since the weekend rebellion pushing for his ouster. Not heard from — President Vladimir Putin or Belarus-bound Wagner chief Yevgeny Prigozhin.

Best of the web

We asked a language model to write career advice based on caterer-turned-coup leader Yevgeny Prigozhin. Here’s what it generated.

Second-quarter corporate profits are set for their biggest drop since the start of the pandemic. But then the worst could be over.

Here’s to not traveling, which turns us into the worst version of ourselves as it convinces us we’re at our best.

Octupus farming — a symbol of what humans should not be doing

The chart

“If this is still a bear market rally it will end up being the longest bear market rally in history (which probably means it isn’t a bear market rally!),” says the Weekly S&P 500 Chartstorm blog by Callum Thomas, head of research and founder @topdowncharts, referring to the below chart:


@joosteninvestor

Top tickers

These were the top-searched tickers on MarketWatch as of 6 a.m.:

Ticker

Security name

TSLA,
-3.03%
Tesla

GME,
-2.55%
GameStop

AMC,
-3.84%
AMC Entertainment

NVDA,
-1.90%
Nvidia

LCID,
-4.54%
Lucid

NIO,
-5.49%
Nio

AAPL,
-0.17%
Apple

SPCE,
-18.42%
Virgin Galactic

MULN,
-4.83%
Mullen Automotive

AMZN,
-0.63%
Amazon.com

Random reads

Man bought lifetime United Airlines pass three decades ago, has “lived like a sultan” ever since.

Kylie Minogue’s “Padam Padam’ single is fast-tracking its way to gay classic status.

Naples tells billionaires to park their superyachts somewhere else.

Need to Know starts early and is updated until the opening bell, but sign up here to get it delivered once to your email box. The emailed version will be sent out at about 7:30 a.m. Eastern.

Listen to the Best New Ideas in Money podcast with MarketWatch reporter Charles Passy and economist Stephanie Kelton.


Source link

#Heres #Wall #Streets #bullish #analyst #heading #year #thinks #stock #market