Buying vs. Selling Options: A Risk Perspective

Options trading represents an intriguing aspect of financial markets, offering both the potential for profit and the risk of loss. Understanding the nuanced differences between buying and selling options is crucial for traders at all levels. This article delves into the inherent risks and strategies associated with both buying and selling options, aiming to provide a comprehensive overview for investors.

What Are Options?

At their core, options are financial derivative contracts. They grant buyers the right, but not the obligation, to buy (call options) or sell (put options) an underlying asset at a predetermined price, known as the strike price, on or before a specified date. This underlying asset could range from stocks and bonds to commodities and indices. The flexibility and potential leverage options offer make them a valuable tool for investors looking to hedge, speculate, or gain exposure to specific market segments.

Buying vs. Selling Options: A Risk Perspective

Buying Options: Defined Risk

When you buy an option, you’re essentially paying for the possibility to execute a transaction in the future at today’s price levels. This transaction could involve purchasing a stock at a lower than the market price or selling it higher if the market moves in your favour. The cost of this opportunity is the premium paid upfront. Therefore, the risk is inherently capped at this premium. Should the option expire worthless (meaning it’s not advantageous to exercise the right to buy or sell), the maximum loss is 100% of the investment in the premium.

However, it’s critical to understand that buying options is not without its pitfalls. The risk of losing the entire premium is real, especially for options that are out of the money—where the current market price is far from the strike price. Time decay also plays a significant role, eroding the value of options as they approach expiration. Moreover, options are susceptible to volatility fluctuations, affecting their price independently of the underlying asset’s movement.

Selling Options: Undefined, Potentially Uncapped Risk

Conversely, selling options involve a higher risk level. Sellers, or “writers,” of options collect the premium upfront but face the obligation to buy or sell the underlying asset if the buyer exercises the option. This exposes sellers to potentially unlimited losses, especially in a volatile market where the asset’s price can move significantly against the position. For instance, selling a call option without owning the underlying asset (a naked call) can lead to substantial financial risk if the market price soars above the strike price.

Understanding the Risks and Rewards of Selling Options

The primary allure of selling options lies in the premium collected upfront, offering an immediate income stream. However, this comes with the caveat of potentially significant, though not always unlimited, risk. The fear of “unlimited losses” often stems from scenarios where market conditions dramatically change, pushing the underlying asset’s price far beyond the strike price of the sold option.

Mitigating Risks Through Strategic Approaches

Experienced traders mitigate these risks through various strategies. One common method is the use of stop-loss orders to limit potential losses. More complex strategies, such as selling options within spreads or writing covered calls, also serve to cap the downside. Covered calls, for instance, involve selling call options on stock already owned, thus providing income while also hedging against potential stock price decreases. However, it’s crucial to remember that such strategies also limit upside potential, a trade-off that traders must consider.

Selling Options vs. Shorting Stocks: A Comparative Risk Analysis

Comparing selling options to shorting stocks illuminates fundamental differences in risk profiles. Shorting a stock—borrowing shares to sell with the hope of repurchasing them at a lower price—exposes traders to potentially unlimited losses, as stock prices can theoretically increase indefinitely. In contrast, selling options provide the seller with a premium and a clearly defined obligation, whether to buy or sell the underlying asset at the strike price. While selling call options can expose one to significant risk if the stock price surges, the risk from selling put options is substantial but not infinite since a stock’s price can only fall to zero.

Advanced Strategies: Combining Buying and Selling Options

For those looking to navigate the risks and opportunities of both worlds, combining buying and selling options in strategies like spreads, butterflies, and iron condors can be effective. These approaches allow traders to hedge risks, exploit volatility, or generate income. However, they require a more profound understanding of options trading and can introduce increased complexity and transaction costs.

Navigating Expiration and Early Exit Strategies

A crucial aspect of options trading is understanding the outcomes as expiration approaches. If an option sold expires worthless, the seller retains the premium, ending their obligation. For options buyers, an option expiring out-of-the-money means the loss of the premium paid. Traders have the flexibility to exit positions before expiration, allowing options buyers to sell for a profit or limit losses potentially and enabling sellers to close positions to secure gains or prevent further losses. However, early exits involve additional considerations, including transaction costs.

Understanding Short Selling

Short selling is essentially a speculative strategy where an investor bets on the decline of a stock’s price. The process involves borrowing shares from a brokerage, selling them at the current market price, and then buying them back later at a lower price. The short seller profits from the difference between the sale price and the repurchase price after returning the borrowed shares to the lender.

The Mechanics of Short Selling

The procedure for short selling is a two-step process:

  1. Borrow and Sell: The investor, believing that a stock’s price will decline, borrows shares from a broker and immediately sells them at the current market price.
  2. Buy Back and Return: The investor anticipates a drop in the stock price. When it decreases, they repurchase an equivalent amount of shares at this reduced price and return them to the lender. The difference is kept as profit.

Example of Short Selling

Imagine an investor speculating that the shares of XYZ Corporation, currently priced at $50, are due to fall. The investor borrows 100 shares and sells them at the current price, receiving $5,000. If the share price drops to $40, the investor then buys back the 100 shares for $4,000, returns the shares to the broker, and realises a profit of $1,000 (minus any fees or interest charged by the broker).

Risks Involved in Short Selling

While short selling can be lucrative, it comes with significant risks:

  • Unlimited Losses: Unlike buying stocks, where the maximum loss is the initial investment, short selling can lead to losses that exceed the initial sale proceeds if the stock price rises.
  • Margin Calls: Short selling involves using leverage, which means you’re required to maintain a margin account. If the stock price rises, you may face a margin call, requiring you to deposit additional funds to cover potential losses.
  • Regulatory and Market Risks: Short selling is subject to regulatory scrutiny and can be affected by market mechanisms designed to curb excessive volatility, such as trading halts or short-squeeze scenarios, where a rapid increase in the stock price can cause significant losses to short sellers.

Strategies for Successful Short Selling

To navigate the complexities of short selling, investors employ various strategies:

  • Thorough Research: Successful short sellers conduct extensive research to identify overvalued stocks or sectors showing signs of weakness.
  • Risk Management: Employing stop-loss orders or options can help limit potential losses. Effective risk management is crucial in short selling due to the potential for unlimited losses.
  • Timing: Timing is critical in short selling. Investors must carefully choose when to enter and exit positions, taking into account market sentiment, upcoming events, and financial reports that may affect the stock price.

Ethical and Economic Considerations

Short selling often faces ethical scrutiny, with critics arguing it can exacerbate market declines during times of financial instability. However, proponents contend that short selling provides liquidity, aids in price discovery, and can help correct market inefficiencies by penalising overvalued stocks.

Risk Management for Sellers

Given the higher risk, option sellers need to employ meticulous risk management strategies. These include setting stop-loss orders, using spreads to limit potential losses, and closely monitoring market movements and positions. Additionally, sellers should have a thorough understanding of the underlying assets and the factors that may influence their price movements.

Options trading offers a spectrum of strategies. These cater to different risk tolerances, investment goals, and market outlooks. Buying options presents a way to engage in the market. It comes with limited risk. This is suitable for those looking to speculate on price movements without the commitment of holding the underlying asset. Conversely, selling options can be a more advanced strategy. It offers income through premiums. However, it requires a greater understanding of risk management. This is to mitigate potentially unlimited losses.

While buying options limit risk to the premium paid, selling options opens up the possibility of unlimited losses. Therefore, the choice between buying and selling options should be based on an individual’s risk tolerance, market experience, and strategic goals. With careful consideration and strategic planning, traders can navigate the complexities of options trading to align with their financial objectives.


Source link

#Buying #Selling #Options #Risk #Perspective
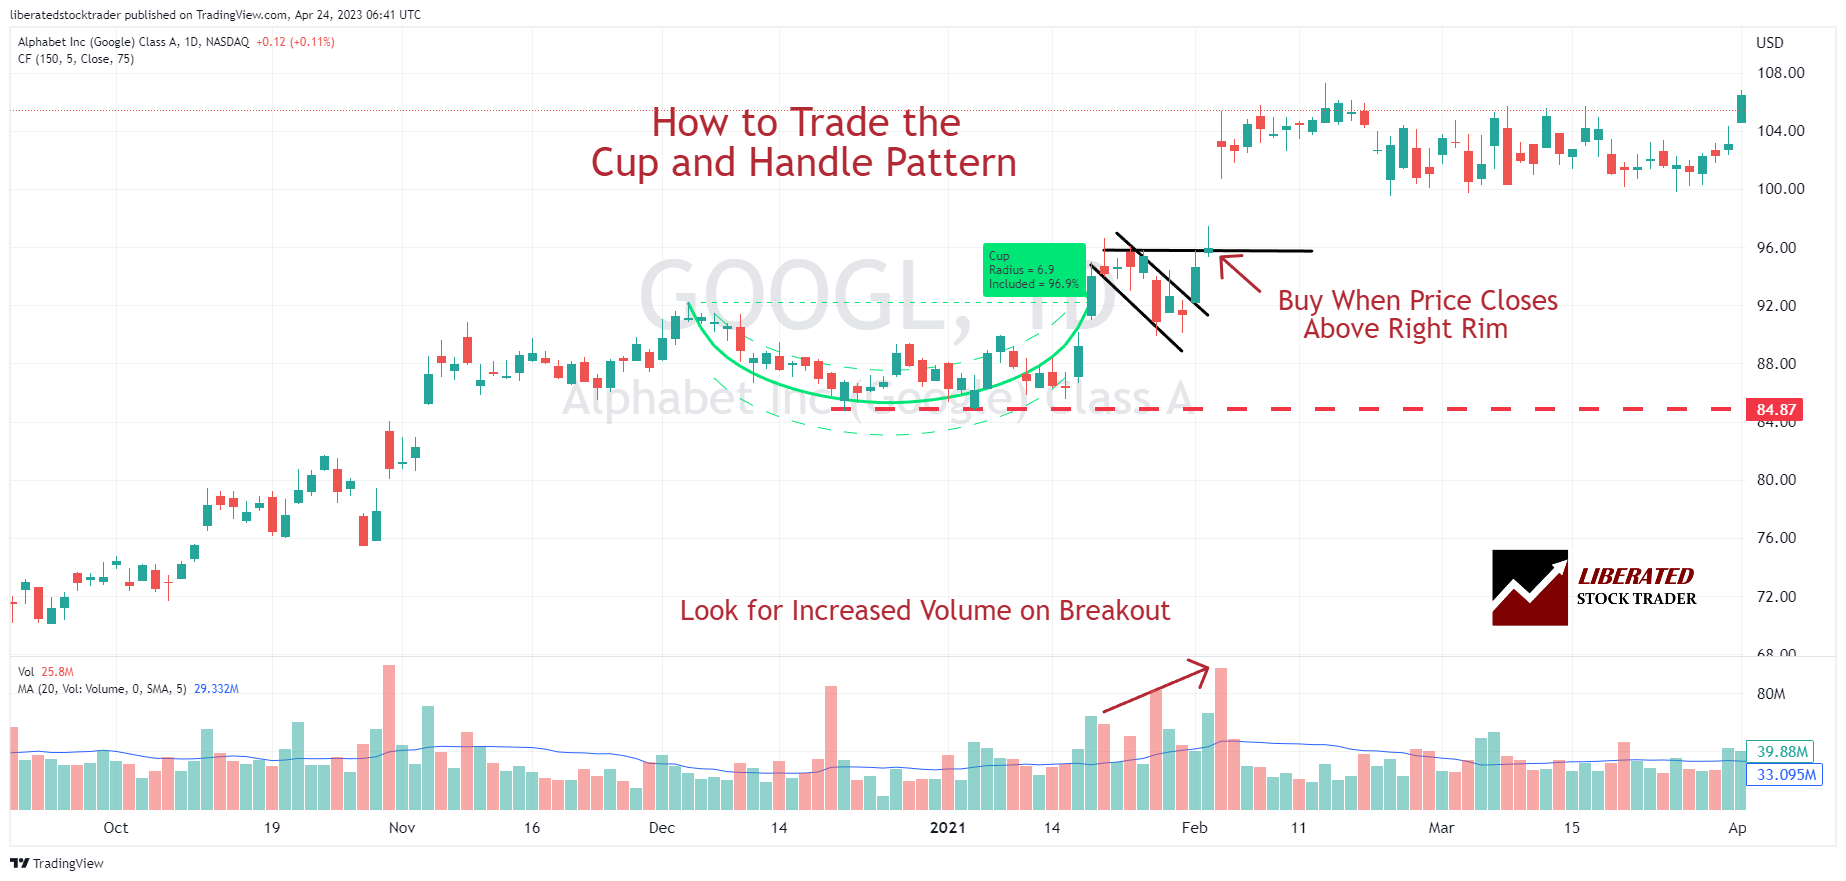
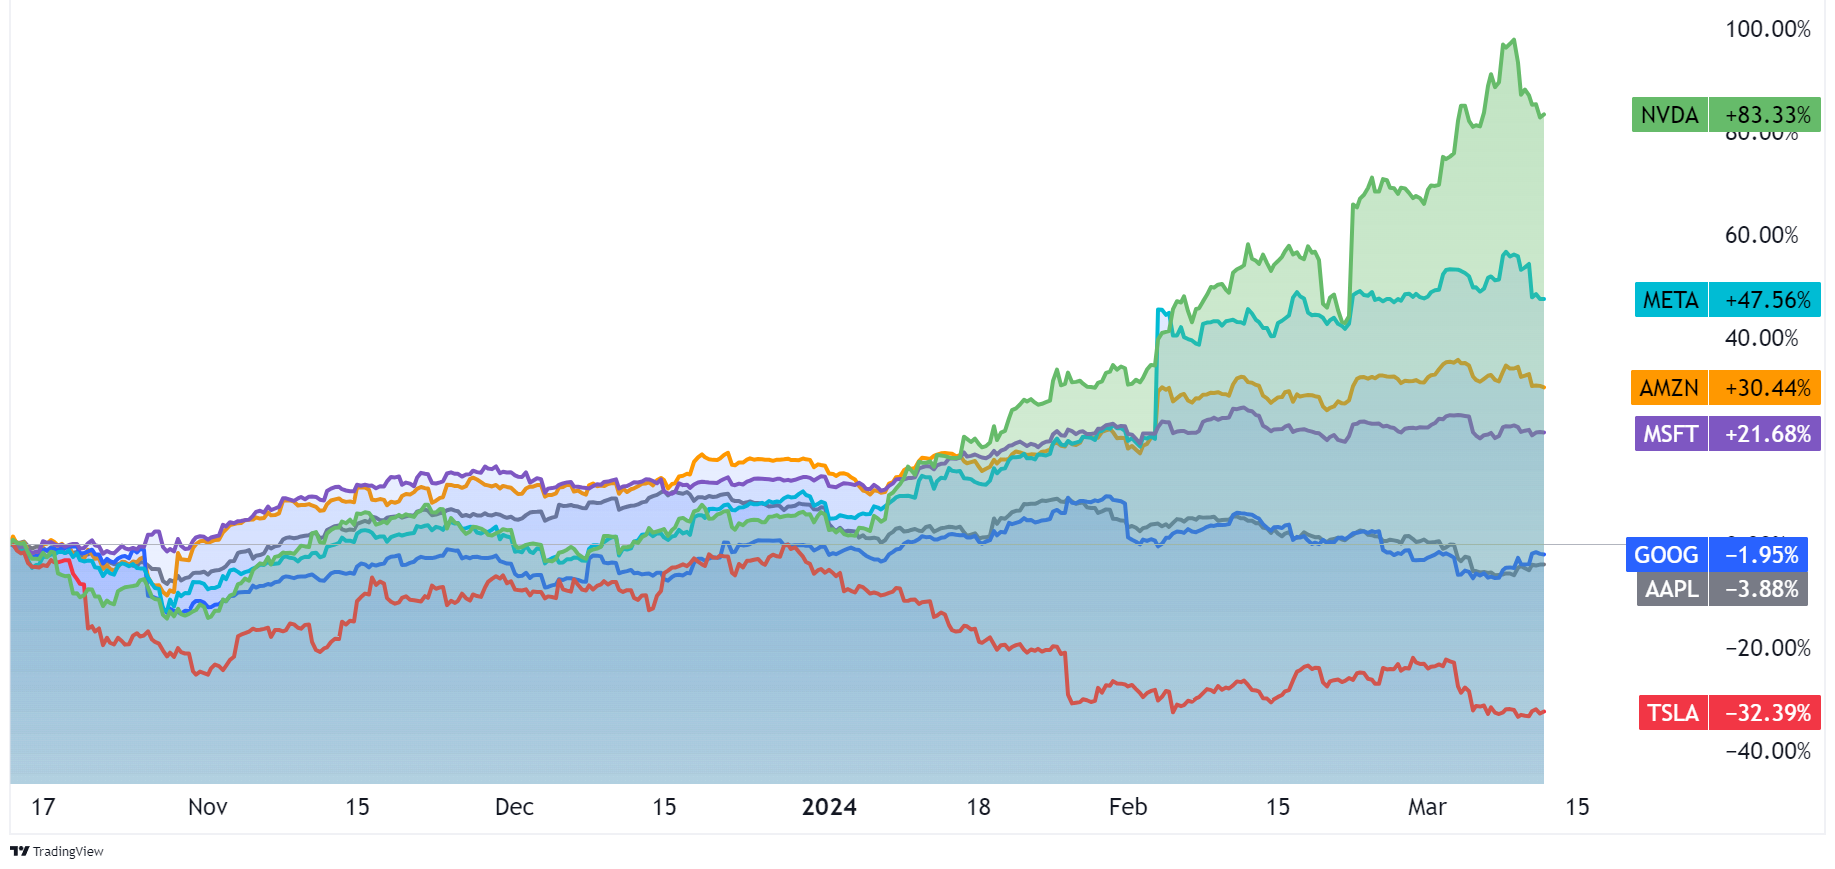
Krystal Integrated Services IPO Review – GMP, Financials & More

Krystal Integrated Services IPO Review: Krystal Integrated Services is coming up with its IPO issue of Rs. 300.13 Cr which will open on 14th March 2024. The issue will close on 18th March and be listed on the exchange on 21st March 2024. This article will analyze the strengths and weaknesses of the Krystal Integrated Services Limited IPO Review 2024. Keep reading to find out!

Krystal Integrated Services IPO Review – About The Company

Apart from these services, the Company also provides production support services, warehouse management, and airport management services, which include multi-level parking & airport traffic management services. In staffing services, the Company provides payroll management as well as private security services and catering services.

The Company operates on a Business-to-Business model across 16 states and 2 union territories of India. It has so far provided its services to 135 hospitals and medical colleges, 228 schools & colleges, 1 airport, 4 railway stations, and over 30 metro stations. 

Some of the notable institutions to whom Krystal has provided its services include Maha Mumbai Metro Operation Corporation Ltd and Brihanmumbai Municipal Corporation. The Company provides bespoke solutions to these institutions sourcing everything from the OEMs themselves and maintaining long-term relationships with the businesses. 

Krystal Integrated Services IPO Review – About the Industry

The global outsourced facility management  Market for CY2022 is valued at USD 890.00 billion and has recorded a growth of 2.1% CAGR from CY2018 – CY2022. Asia is the largest market globally with a share of 33% as of CY2022. It is expected to reach USD 479.6 billion by CY2027 at a 10.6% CAGR, with China and India being the main growth drivers. 

Industrial, Public Administration, defense, and railways are the three top-end user segments of the Integrated Facilities Market in FY23, with a combined market share of 53.1%. Other prominent segments were commercial offices, healthcare, educational Institutions, airport retail and residential segments.

Indian Integrated Facilities Management Market is highly fragmented with close to 400 – 500 companies operating across the country. There are around 6 large companies in the Tier 1 category that have their presence across geographies and control about 9.4% of the total market. 

Tier 1 companies have a country-wide presence serving almost all the end-user segments and have a vast client base. Around 60 – 70 companies belong to Tier 2 and have a regional presence while more than 400 companies belong to the Tier 3 category and operate in a small geographic zone, for example, a single city or town. 

The market also witnesses the presence of both international and domestic companies. International companies’ sub-contract the majority of their services to gain access to various markets, manpower, and customers in the region. 

Krystal Integrated Services IPO Review – Financials

During FY23, the Company earned a gross revenue of Rs. 708 Cr, which increased by 28% from Rs. 553 Cr in FY22. Since FY21, the revenue of the Company has increased by 23%. Krystal Integrated Services earns nearly 38% of its revenue from the healthcare segment, which has also been growing at a CAGR of 29% since FY21.

Education contributes to 21% of revenue followed by Airports, railways, and metro infrastructure which contribute to around 7% of revenue. Net Profits of the Company have increased by 46%, from Rs. 26 Cr in FY22 to Rs. 38 Cr in FY23. The net profits have increased significantly as a result of reduction in Employee expenses reducing as a percentage of revenue, from 85.3% in FY22 to 83.65% in FY23.

As the Company is into providing a service to its customers via its contractual employees, it operates on single-digit margins of 6-8%. Net Profit Margins have improved from 3.5% in FY21 to 5.4% in FY23.

Also Read…

Krystal Integrated Services IPO Review – Key Players 

In terms of a peer-to-peer analysis, Krystal Integrated Services is the smallest listed peer in terms of revenue. Quess Corp and SIS Ltd are the leaders of the industry. However, the leaders of the industry do not have a return on Net Worth as high as that of Krystal at 24%. If the Company continues to scale its profits further, RoNW is expected to know even more. 

Nevertheless, at the higher end of the price band of Rs. 715 compared to a basic EPS of Rs. 33.33, the Company will be valued at a Price-to-Earning of 21.45x, which is a lot higher than the median PE of 15.16x of its peers.

RHP of Krystal Integrated Services
Source: RHP of the Company

Strengths of the Company 

  1. Comprehensive range of solutions: The company offers a multitude of solutions across different fields of business. This allows Krystal to cater to a variety of customers
  2. Focused business model: The Company business is generally focused on developing deep and strong relationships among a few of the largest clients. It also has a track record of undertaking and successfully executing orders on a really large scale.
  3. Wide reach across India: As of September 2023, the Company has served over 2160 customer locations across 16 states & 2 union territories. This allows the Company to take up outsourcing jobs and deploy its workforce across the country.
  4. Strong track record: The Company’s performance is backed by a strong financial track record in the past three years. Revenue scaled by 20% and an expansion of margins caused Net Profits to increase by as much as 40%.

Weaknesses of The Company

  1. Customer Concentration Risk: The Company’s top 5 customers contribute to 35% of revenue while the top 10 customers bring in over 60% of revenue. This kind of exposure to the largest client can be detrimental to revenue in case it loses its top clients.
  2. Exposure to Government Contracts: A significant portion of the Company’s revenue, nearly 74% was from the government contracts signed by the Company. The Company has to get a proper balance across both government & non-government contracts
  3. Geographical Concentration Risk: Although Krystal operates its business in 16 states, ~80% of the Company’s revenue comes from just two Indian states, Maharashtra and Tamil Nadu.
  4. Operational Risk due to the inherent nature of business: The operations undertaken by the business such as private security, and facility management are dependent on the performance of the Company personnel. However, any disruption or defect from his end could have a monetary & reputational impact on the Company.

Krystal Integrated Services IPO Review – GMP

As of the date of writing this article, the Grey Market Premium for the shares was Krystal Integrated Services Ltd has not yet been published. We will update the article with the respective expected as soon as its GMP is updated.

Krystal Integrated Services IPO Review – Key Information

Promoters: Prasad Minesh Lad, Neeta Prasad Lad, Saily Prasad Lad, Shubham Prasad Lad, and Krystal Family Holdings Pvt Ltd. 

Book Running Lead Manager: Inga Ventures Pvt Ltd.

Registrar to the Offer: Link Intime India Pvt Ltd

The Objective of the Issue

  1. Rs. 10 will be utilized for repayment of borrowings
  2. Rs, 100 Cr will be utilized for the working capital requirements of the Company
  3. Rs. 10 Cr will be utilized for the purchase of new machinery.
  4. The remaining amount will be utilized for General Corporate purposes

Conclusion

Krystal Integrated Services is a contract-based management outsourcing  Company, that provides a comprehensive range of personnel solutions. The Company is an organized giant in a rather unorganized and fragmented market, with a strong financial performance. 

While Krystal Integrated Services has wide service offerings, a focused business model, and a strong presence across India, it also faces certain weaknesses. These include customer concentration risk, exposure to government contracts, geographical concentration, and operational risks inherent to the nature of its business.

Overall, the growth opportunities of the business look quite dismal as they totally depend on the overall industry to grow, which is currently growing at a very slow rate. With that said, what do you think about the Company? Let us know in the comments below if you will apply or avoid Krystal Integrated Services IPO.

Written by Nasir Hussain

By utilising the stock screenerstock heatmapportfolio backtesting, and stock compare tool on the Trade Brains portal, investors gain access to comprehensive tools that enable them to identify the best stocks, also get updated with stock market news, and make well-informed investments.


Start Your Stock Market Journey Today!

Want to learn Stock Market trading and Investing? Make sure to check out exclusive Stock Market courses by FinGrad, the learning initiative by Trade Brains. You can enroll in FREE courses and webinars available on FinGrad today and get ahead in your trading career. Join now!!

Source link

#Krystal #Integrated #Services #IPO #Review #GMP #Financials

The Best Month to Buy Stocks: 53 Years of Analysis

According to our research, using 53 years of stock exchange data, the best time to buy stocks is in October, and the best time to sell stocks is in July.

Although each day, week, and month differs from year to year, there are common trends across the decades. I will answer these questions using 53 years of statistical stock market data.

The Best Months to Buy Stocks

A 31-Year Seasonality Chart for the S&P500

Data By TrendSpider: Our Favorite Trading Analysis Tools

What is the Best Month to Buy Stocks?

The best month to buy stocks is October, as the S&P500 has increased 1.2% in 16 of the last 23 years. Using stock market data from 1970 to 2023, October returns 1%, November 1.6%, and December 1.4%.

The high performance in December might also show evidence of the Santa Claus Rally.

What is the Worst Month for Stocks?

Our data research shows that from 1970 to 2023, the worst month for stocks was September, with an average loss of -0.90%. So, if you are considering selling stock, it would be strategically better to sell towards the end of August.

Table: S&P 500 Monthly Returns 1970 to 2023

Month % Return
Jan 1.1%
Feb 0.2%
Mar 1.0%
Apr 1.4%
May 0.4%
Jun 0.2%
Jul 0.9%
Aug 0.1%
Sep -0.9%
Oct 1.0%
Nov 1.6%
Dec 1.4%

The Best Months to Buy Stocks: 1970 to 2023

From 1970 to 2023, the best month to buy stocks was October because October, November, December, and January are the four strongest months, returning a cumulative average of 6%.

The Best Months to Buy Stocks: S&P 500 Monthly Returns 1970 to 2023

If you bought stocks in March and held them for six months, the cumulative average return is 4.1%.

The 3 Best Months to Buy Stocks

Over the past 50 years, November (+4.1%), December (+1.4%), and April (+1.4%) have been the three best months to buy stocks. February, June, and August return very little profit, less than 0.2% per month.

The 3 Best Months To Buy Stocks Over 53 Years

Breaking down the last 53 years into returns per month and decade, a different picture emerges. The 2000s and the first three years of the 2020s have changed expectations. The years 2000 to 2010 saw terrible economic and stock market recessions. 2020 to 2023 has been extremely volatile, both on the upside of positive returns and the stock market crash of 2022.

The 3 Golden Months to Buy Stocks

Despite the 1970s crash, the 2000 Dotcom crash, the 2008 financial crisis, and the 2020 Covid crash, October, November, and December all returned a positive 1% to 1.6% return.

This chart details the average monthly returns in percent broken into decades: 1980s, 1990s, 2000s, and the three years 2020 to 2023. Incredibly, October, November, and December remain positive throughout all crashes and recessions.

The Best Months to Buy Stocks: S&P 500 Monthly Returns Per Decade 1970 to 2023


Beat The Market, Avoid Crashes & Lower Your Risks

Nobody wants to see their hard-earned money disappear in a stock market crash.

Over the past century, the US stock market has had 6 major crashes that have caused investors to lose trillions of dollars.

Moses Index ETF Strategy

The MOSES Index ETF Investing Strategy will help you minimize the impact of major stock market crashes. MOSES will alert you before the next crash happens so you can protect your portfolio. You will also know when the bear market is over and the new rally begins so you can start investing again.

MOSES Helps You Secure & Grow Your Biggest Investments
★ 3 Index ETF Strategies ★
★ Outperforms the NASDAQ 100, S&P500 & Russell 3000 ★
★ Beats the DAX, CAC40 & EURO STOXX Indices ★
★ Buy & Sell Signals Generated ★
MOSES Helps You Sleep Better At Night Knowing You Are Prepared For Future Disasters

Find Out More


The Best Months to Buy Stocks: 2000 to 2023

From 2020 to 2023, October was the best month to buy stocks, and the stock was held for three months until the end of December. October, November, and December are the only three months that have returned positive results over the last 23 years.

The Best Months to Buy Stocks: S&P 500 Monthly Returns Per Decade 2000 to 2023

How the Stock Market Has Changed Since the 1970s

Not all decades are created equally; the 1970s and 1980s were relatively stable despite the oil shock of the 1970s and the inflation of the 1980s. However, the advent of the Internet, online trading, the popularity of stock options, high-frequency trading, and the growth of trillion-dollar corporations have made the stock market much more volatile.

S&P 500 Historical Returns 2000 to 2020

2020 to 2023 has been exceptional due to a pandemic crash in 2020, a boom in 2021, and a crash again in 2022. Any monthly statistical reference should exclude the 2020s.

The Best Months to Buy & Hold Stocks (1970 to 2020)

For the last five decades, you can see that buying stock in October and holding until July has, on average, been a good strategy.


Invest in yourself! Get all our courses & strategies for 50% off

Stock Investment Courses: All Star Pass - Full Access To All Pro Stock Market Training & Winning Strategies

★ Liberated Stock Trader Pro Stock Investing & Trading Course ★
★ M.O.S.E.S. Market Outperforming ETF Strategy ★
★ LST Beat the Market Stock Picking Strategy ★
★ Exclusive Bonus Course – The Stock Market Crash Detector Strategy ★
★ Fully Guided Videos, eBooks & Lifetime Email Support ★
★ 108 Videos + 3 Full eBooks + 5 Scripts for TradingView & Stock Rover ★

All Star Pass Black Friday -50% Deal Is Live – Ends In:


The Seasonal Effect on the Stock Market

There is a seasonal effect, and it does repeat itself. This could be due to retail sales, summer commodities harvest, and the build-up to the Christmas selling period.

Ultimately, the economy’s state and the government’s stewarding fiscal and monetary policy play a leading role here. We know that the ’80s and ’90s were decades of unprecedented growth, and the 2000s was a decade of payback with two severe crashes, the Dotcom bust (2000) and the Financial Crisis (2007); this is reflected in the chart above.

From 1980 to 2000, January to June was positive, and October to December was negative. Only August and September were not 100% positive in terms of gains—that is, 10 of the 12 months.

From 2000 to 2009, 5 of the 12 months were negative: January, February, June, July, and September.

The Best Months to Buy Stock: 2000 to 2023

Months 2000-2023 Average % Return
Jan -0.5%
Feb -0.6%
Mar 1.2%
Apr 1.9%
May 0.3%
Jun -0.7%
Jul 1.5%
Aug 0.1%
Sep -1.5%
Oct 1.6%
Nov 1.8%
Dec 0.6%


The Best Months to Buy Stock

In the 2022 bear market, the best months to buy S&P 500 stocks were March +3.59%, July +9.11%, October +7.99%, November +5.38%, and December +3.74%; all other months returned losses.

What is the Best Month to Sell Stocks?

Our data analysis shows that August is the best month to sell stocks from 1970 to 2023. Specifically, the best time to sell would be toward the end of August, as September is typically the worst month for stock market declines. September averaged a loss in all five decades from 1970.


You want to be a successful stock investor but don’t know where to start.

Learning stock market investing on your own can be overwhelming. There’s so much information out there, and it’s hard to know what’s true and what’s not.
Stock Market Investing Training - Liberated Stock Trader Pro

Liberated Stock Trader Pro Investing Course
Our pro investing classes are the perfect way to learn stock investing. You will learn everything you need to know about financial analysis, charts, stock screening, and portfolio building so you can start building wealth today.
★ 16 Hours of Video Lessons + eBook ★
★ Complete Financial Analysis Lessons ★
★ 6 Proven Investing Strategies ★
★ Professional Grade Stock Chart Analysis Classes ★

Find Out More


Summary

The single best month to buy stock over the last 50 years and in every decade has been October.

Of course, what you buy is key. If you invest in an Exchange Traded Fund that tracks the S&P 500 or any major market index, this trend should hold true until the trend changes.

If you invest in individual stocks, this market index analysis will bear little correlation to your purchased stock. The charts above show the performance of all the stocks in the index.

Remember, although a stock may increase or decrease due to the ebb and flow of the underlying market direction, the fundamentals of the stock you purchase, combined with your timing, will ultimately determine the long-term profitability of the investment.

Frequently Asked Questions

What is historically the best time to buy stocks?

Historically the best time of year to buy stocks is in October. Based on 53 years of data, October is the start of 5 months of positive returns to the end of January, averaging a 5.1% return.

What are the best and worst months for the stock market historically?

Over the past 50 years, November has been the best month to buy stocks, as it has the highest average return of 1.6%, followed by 1.4% in December. The worst month to buy stocks is the start of September, which has lost 0.9% every decade since 1970.

What month is historically the best month to sell stocks?

The best month to sell stocks before a stock market decline is the end of July. Using 50 years of data, we determine that August has both positive and negative returns, and September is, in every decade, the month to avoid.

What months are stocks the lowest?

Our 50-year research shows that stocks are at their lowest at the end of September. Summing all the S&P 500 gain and loss percentages in September since 1970, the loss would be -46.9%. So avoid September at all costs.

What are the worst months in stock market history?

The worst month in the last 50 years of stock market history was October 1987, the S&P 500 index lost 28.8%. October 2008 was the second worst, losing 16.9%. August 1998 was also bad, losing 14.6%.

Do stocks typically go down in December?

No, stocks do not typically go down in October. Our research shows that October is a great time to buy stocks because October market the start of the best four months of stock market returns. From 1970 to 2023, the average monthly return from October to January is 1% to 1.6%.

Is November the best month for stocks?

Yes, November has been the best month for the stock over the last 53 years. November returns on average 1.6%. Historically, it is worth buying stocks in October because October returns 1%, November 1.6%, December 1.4%, and January 1.1%.

Do stocks usually go down in January?

No, stocks do not usually go down in January. From 2000 to 2010, stocks went down on average 1.9% in January. However, looking at the longer term, from 1970 to 2023, stocks increased by 1.1% in January.

Why do stocks go down in January?

On average, stocks do not go down in January. From 2000 to 2009 and 2020 to 2022, stocks have declined on average by 2%. But over the long term, January is a good month to buy stocks, with an average gain of 1.1% since 1970.

Do stocks rise or fall around Christmas?

Stocks typically rise around the Christmas period. Over the last 50 years, October through to January have been the best time to buy stocks, with each month averaging between 1% and 1.6% per month gain on the S&P 500.

Is it better to buy stocks before or after Christmas?

It is better to buy stocks before Christmas. Our research proves buying stocks in October is the best strategy. October marks the start of a four-month run of above-average stock market gains between 1% and 1.6% per month to January.

Is December the best time to buy stocks?

While December is a good month to buy stocks, the best months are October and November. September typically averages a 0.9% loss, so buying stocks at the start of October, rather than December, usually returns the best profits over the Christmas period.

Is February a good month for stocks?

No, February is not a good month for stocks. From 2000 to 2023, the stock market lost on average 0.6%, making it one of the worst months to buy stocks. Data suggests waiting until the start of March to buy stocks, as March and April typically return 3.1%

Are stocks higher in January?

Over the last 53 years, stocks are higher in January. However, from 2000 to 2009, stocks lost 1.8% on average, and from 2020 to 2023, stocks lost 2.1%. January is a mixed bag of returns and cannot be accurately predicted.

Why do stocks go down in winter?

Stocks typically do not go down in winter. In the northern hemisphere, winter starts in November, and November is the single best month for stocks historically from 1970 to 2023. November through to January (the Winter months) are the best months for stocks.

Why do stock prices fall in December?

Typically stock prices do not fall in January. Of course, in any specific year, stocks can rise or fall, but on average, from 1970 to 2022, December has seen S&P 500 stock prices rise by 1.4%.

Is it better to sell stock in December or January?

From 1970 to 2023, data suggests it is better to sell stocks at the end of January. However, our chart above suggests if you consider data from 2000 to 2023, it is better to sell at the end of December.

Why do investors sell in December?

Investors who only analyze data from the last 20 years consider January a bad month and sell stocks. But over the long term, January is a positive month. Investors might sell in January because February is the second worst month to hold stocks.

Are stocks higher in summer or winter?

Analytical data proves that stocks move much higher during winter rather than summer. In this chart, four of the best six performing months are October through January.

The Best Months to Buy Stocks: S&P 500 Monthly Returns 1970 to 2023

When is the best time to buy stocks?

If you live in the northern hemisphere, the best time to buy stocks is when the leaves on the trees turn golden and the nights get colder. Yes, October and November are statically the best time to buy stocks.

Is a recession the best time to buy stocks?

This is a great question, and yes, during the worst times of a recession is the best time to buy stocks. Just be careful not to buy stocks in companies that might go bankrupt, as you will lose all your invested capital. During a recession, buy companies with a strong cash flow and balance sheet.

How You Can Research the Stock Market

You can perform powerful stock market research using TradingView (for traders) or Stock Rover (for investors), our recommended award-winning stock charting and analysis software. Read our detailed reviews and testing to learn more.

TradingView Review 2024: Tested by LiberatedStockTrader

Stock Rover Review 2024: Is It The Best Stock Screener?

Source link

#Month #Buy #Stocks #Years #Analysis

7 Best Stock Picking & Advisory Services 2024

Our stock advisor review and tests show the best stock picking services are Motley Fool Stock Advisor, Morningstar, AAII, and Zacks. Stock Rover is the best stock research tool alternative to stock picking services.

Stock Picking & Advisory Service Ratings

Research/Stock Picking Service Rating Price Per Year
Motley Fool Stock Advisor ★★★★★ $199
Morningstar Premium ★★★★★ $249
Stock Rover Premium Plus ★★★★★ $279
AAII Plus Membership ★★★★☆ $97
Zacks Ultimate ★★★★☆ $2995
IBD Leaderboard ★★★☆☆ $828
Seeking Alpha Pro ★★★☆☆ $2400

Motley Fool vs. MorningStar, Seeking Alpha, IBD, AAII & Zacks

Motley Fool and Zacks claim a yearly return of 24%, Seeking Alpha a 36% return, and MorningStar provides no track record. Motley Fool and Seeking Alpha offer similar services at $199, But Zacks Ultimate costs $2,999 for the same claimed performance.

Stock Advisor Motley Fool Stock Rover Morningstar AAII Zacks IBD Seeking Alpha
Service Stock Advisor Premium Plus Premium Plus Zacks Ultimate Leaderboard SA Quant
Rating7 Best Stock Picking & Advisory Services 2024 - 56 ★★★★★ ★★★★★ ★★★★★ ★★★★☆ ★★★☆☆ ★★★☆☆ ★★★☆☆
Research Reports Stocks
Real-Time Research Reports
Analyst Research Reports
Fund Research Reports
Long-Term Investing
Stock Ratings
Portfolio Mgt Tools
Short-Term Trading
Buy Signals
Price Per Year $199 $279 $199 $97 $2995 $828 $2400
Visit Motley Fool Stock Rover Morningstar AAII Zacks IBD SA

We independently research and recommend the best products. We also work with partners to negotiate discounts for you and may earn a small fee through our links.

The Best Stock Research Tool

Stock Rover is the best stock research tool we tested, offering excellent research reports and elite stock screening for value, growth, and income investors. Stock Rover is the best choice if you want to independently research stocks, construct diversified portfolios, and implement powerful screening strategies.

The Best Stock Picking Service

Our research reveals the best stock picking service is Motley Fool’s Stock Advisor, based on value for money and independently tested track record data. Motley Fool provides clear audited stock picks and outperforms the S&P500.

Our testing also shows that the Zacks Ultimate stock advisor and Seeking Alpha Quant services claim a 24% annual gain. In contrast, Morningstar offers the broadest selection of analyst research stock and ETF research reports.

Best Stock Advisors & Stock Picking Services

Stock research can be time-consuming and requires a thorough understanding of financial metrics and the knowledge to develop and implement a specific investing plan.

Each of the seven stock advisor services in this review is a major player in the stock-picking and research arena. While there is no single best stock advisor, we have selected seven well-known companies and tested their services. Have a read, and decide which best suits your needs and budget.

The Best Stock Advisor Services of 2024

1. Motley Fool Stock Advisor: Winner Best Stock Advisor

Motley Fool’s Stock Advisor service is the best stock-picking service because it has a proven track record of outperforming the market. Motley Fool selects only stocks with a high probability of significantly beating the underlying market index. The service is easy to use and has a track record of significantly outperforming the market over the last 18 years.

One of the first books I read on investing was the Motley Fool Investment Guide in 1997. The Motley Fool investment team has not looked back since. While I love to perform my own research and not be influenced by others, I have found the Motley Fool Stock Advisor Service incredibly useful.

Motley Fool offers 32 premium services, from the most popular Stock Advisor and Rule Breakers to advice on real estate investing. Stock Advisor and Rule Breakers are the only services sharing market-beating performance.

The Motley Fool premium stock research reports are clear and precise, focusing on the company’s financials but, most importantly, the industry’s future and business outlook. This is important because if you want market-beating results, you must select companies that are potential industry disruptors and market dominators.

I have subscribed to Motley Fool Premium for four years because I value their qualitative analysis. My initial reason for subscribing to the service was to test if they were legitimate or a scam. I was amazed at how simple and successful their service is.

Not only am I a paying subscriber, but I have also recently partnered with Motley Fool because I can wholeheartedly recommend their service.

Unlike Morningstar, Motley Fool does not try to perform research on every stock and fund in the USA. The team focuses on stocks that will significantly beat the S&P 500 over the long term. They then provide lightweight, easy-to-read research reports and recommend why they feel the stock will be a superior long-term investment.

Cumulative Growth of a $10,000 Investment in Stock Advisor

You can manage your favorite stocks through their simple-to-use portfolio tracker, although, unlike Stock Rover, they cannot connect to your broker. Motley Fool is the first in this list to provide its audited track record of performance against the underlying benchmark. This is unique about the service; they try to beat the market and help you succeed in the long term. You could give them a try and follow their advice.

Motley Fool Stock Advisor Portfolio Performance 20-Year Results

  • Motley Fool Stock Advisor 421%
  • S&P 500 85%

Motley Fool Stock Advisor Test Results Summary

My independent analysis of the stock advisor service’s audited results reveals that since 2002, 48% of the stocks beat the S&P 500. The average winning stock outperformed the S&P 500 by 780%. 28% of the stocks recommended lost 42% on average, while 62% made a profit averaging 640%.

What does this mean? You still have a 28% chance of losing money on any stock recommendation. But at current performance levels, you have a 72% chance of investing in a company that will make you a profit.

The Stock Advisor service is well-priced at only $199 and provides an audited track record of successful stock selection. The research reports are easy to read, act upon, and target long-term investors. They provide specific buy and sell signals on stocks they recommend, but the service does not include fund ratings.

 Get 50% Off Stock Advisor


2. Morningstar: Best for Stock & ETF Ratings & Research

MorningStar is one of the best mainstream stock research sites, with over 250 analysts providing research reports for all stocks and funds in the USA. MorningStar analysts use a proprietary methodology to rate each stock based on the industry’s competitiveness, the company’s financial health, earnings growth, and fair value.

The research reports provided by Morningstar are curated; this means they are human-written reports by analysts. They have also popularized the idea of an “Economic Moat,” meaning that if a company has a wide moat, it has a sustainable competitive advantage over its rivals.

Morningstar Ratings & Stock Research

Morningstar is a leader in ETF and Mutual Fund ratings, so if you invest heavily in ETFs for diversification, this service could be ideal. Additionally, Morningstar provides portfolio management tools to enable you to evaluate and balance your portfolio.

Unlike Stock Rover’s research reports, which are generated in real-time and change quickly based on daily financial events, Morningstar reports are updated only quarterly. MorningStar research reports are great for a qualitative view of stocks, whereas Stock Rover excels at quantitative analysis of the financials.

Morningstar is easy to use and packed full of great features and ratings. Add to this the fact it costs only $249 per year, and you have a well-balanced service.

Morningstar Premium is a competitively priced service targeted to long-term investors, providing detailed curated analyst reports and stock rankings to help improve your overall stock picking. The service does provide overall buy and sell signals but does not divulge the performance of its stock recommendations.

Get a 14-Day Free Trial + $100 Discount at MorningStar


3. Stock Rover: The Best Alternative to Stock Advisors

Stock Rover is the best stock research website for self-directed investors because it allows you to research and implement powerful dividend, value, and growth strategies. Stock Rovers’ screening engine and filters offer an industry-leading 650 data points and a huge 10-year historical financial/fundamental database.

Stock Rover is a powerful, mature stock screening, portfolio management, and stock research platform. The list of fundamentals you can scan & filter on is truly huge. Watchlists have fundamentals broken into Analyst Estimates, Valuation, Dividends, Margin, Profitability, Overall Score, and Stock Rover Ratings. You can set the watchlists and filters to refresh every minute.

Video: Stock Rover Research Tool

Try Stock Rover Now

Stock Rover’s Ratings Engine

Stock Rover has implemented great functionality; I particularly like the roll-up view for all the scores and ratings. Below, you can see I have imported a Warren Buffett portfolio, which includes his top 25 holdings. I have also selected the “Stock Rover Ratings” tab. This “Stock Rover Ratings” tab rolls all analyses into a simple-to-view ranking system, saving time and effort while providing a wealth of insight.

Stock Rover has over 150 pre-built screeners that you can import and use. You need to have the Premium Plus service to take advantage of this. I have reviewed many of them, and they are very thoughtfully built. One of my favorites is the Buffettology screener.

Stock Rover Warren Buffett Screener
Stock Rover Warren Buffett Screener – This screener is based on criteria described in the bestselling Buffettology book. The company should have a 10-year track record of generally increasing EPS with no negative earnings years; long-term debt, not more than five times annual earnings; average ROE over the past 10 years of at least 15%; average ROIC over the last ten years at least 12%, and earnings yield should be higher than the long term Treasury yield.

Stock Rover Research Reports

One of the best features of the Stock Rover platform is the Dynamic Research Report. This service lets you generate a professional, readable PDF report on any stock’s current and historical performance.

The research report creates something new: a human-readable, real-time report highlighting a company’s competitive position, market position, and historical and potential dividend and value returns. The image below shows the dividend-adjusted commentary on Microsoft, a company I invested in because I found its excellent potential using my Buffett Stock Screener.

Stock Rover Real-time Research Reports

The best thing about Stock Rover’s Research Reports is they are Real-time, so the information is always up-to-date.

The Research Reports provide a genuinely comprehensive summary of any of the 10,000+ stocks in Stock Rover on the US and Canadian exchanges. Research reports can be viewed in the browser and produced in PDF format for portability and sharing.

Stock Rover Summary

Stock Rover provides the best software for value and income investors. A 10-year financials & fundamentals historical library plus incredible scanners including Warren Buffett & Ben Graham’s favorite criteria. Fair Value, Margin of Safety, and so much more. Even better, there are so many curated screeners and portfolios to import and use that you are instantly productive. It’s impressive how user-friendly Stock Rover is, given its numerous powerful scoring and analysis systems.

Finally, Stock Rover also includes Morningstar fund ratings in its database, enabling you to build a portfolio of 5-star rated Morningstar funds without buying a Morningstar subscription.

Stock Rover is the software for you if you are a long-term investor.

Try Stock Rover Free


4. AAII: Model Portfolios & Research For Stock Picking

The American Association of Individual Investors (AAII) provides model portfolios and stock-picking advice for independent investors. AAII is an independent nonprofit corporation. AAII functions as an association that makes money by selling membership dues or subscriptions.

The AAII membership gives subscribers access to a wide variety of information and digital products. The AAII information products are portfolios, news, and advice. The AAII delivers most of those products digitally through its website and app.

The main product offerings at AAII include The AAII Journal, the Top ETFs Guide, the Top Funds Guide, the AAII Investor Sentiment Survey, and free reports. Other products include classes, videos, and advice.

The AAII Journal is a monthly investment magazine that focuses on educational articles. The AAII Journal also features many market commentary pieces.

The AAII Journal often focuses on one aspect of investing. For example, the March 2021 issue contained two articles on bond ratings. There are also articles on insights, ETFs, dividends, and portfolios.

AAII Review - American Association of Individual Investors
AAII Review – American Association of Individual Investors

AAII Plus Tools Highlights

  • Daily Top and Bottom Stock Lists by Rating
  • Daily Stock Ideas
  • A Portfolio Diversification Analyzer
  • Daily Stock Guru Screens
  • Stock Guru Strategies
  • Daily Stock Factor Screens
  • Stock Rating Upgrade and Downgrade Alerts
  • Stock Screen Power Rankings
  • Reports on Analyst Ratings and Recommendations
  • Stock Factor Screens

The screens and screeners are computer screens that offer specific data about stocks. For instance, Daily Stock Screens evaluate stocks for value, growth, momentum, EPS, and quality. The screeners can show an investor if a stock meets their criteria.

The My Stocks and My Screens allow investors to monitor customized lists of stocks. The Stock Grades Screener allows investors to grade “stocks” using the grading system used in most American schools. The system is the A to F grades, with A being the best and F the worst.

Screen Power Rankings rank stocks by various criteria, including guru strategies. Other tools allow investors to identify top and bottom ETFs and Consistent Performers.

The A+ Investor Toolkit is a package of premium investor tools from the AAII. The A+ Investors offer in-depth analysis and tracking of professional fund managers and evaluation of management teams.

The idea behind the A+ Investor Toolkit is to give investors one place to monitor the performance of all their stocks, mutual funds, and ETFs. Also, the A+ Investor Toolkit offers fast access to most of AAII’s investing tools and screens.

AAII Portfolios

The Model Portfolios are among the most popular tools the AAII offers. One of the most popular AAII offerings is the AAII Model Shadow Stock Portfolio.

They designed the Model Shadow Stock Portfolio to offer maximum gains from investments without a significant time or work commitment. The AAII claims the Model Shadow Stock Portfolio has outperformed market benchmarks by a four-to-one ratio for the last 20 years.

The AII Dividend Investing Portfolio is designed to maximize income and growth from a diversified portfolio of dividend-paying US companies. The Stock Superstars Portfolios share rockstar investors’ suggestions and strategies, such as ch William O’Neil, Dreman, James O’Shaughnessy, and John Neff.

Try AAII


5. Zacks: A High Performing & High Price Stock Advisor

The Zacks Ultimate stock advisor plan covers all its services, including Short Selling Lists, Value Investing, ETF Investing, and Zacks’s Top 10 Stocks. Zacks claims a 24.4% annual return for the service.

To access Zacks’s research reports, you must purchase the ZACKS Ultimate service, which costs $2995 annually. This is one of the highest-priced stock research & reporting services for individual investors in the USA. However, for this investment, you get a comprehensive service covering trade recommendations for short-term trading through income and longer-term growth investing strategies.

Zacks Ultimate Investment Research Services

It is probably better to decide if you want to invest or trade before you buy a Zacks subscription because if you want to invest, then the Zacks Premium service, priced at a reasonable $249 per year, will give you access to their top 50 stock recommendations and the Zacks #1 Rank List research reports.

Zacks claims one of the highest yearly returns of all research services, with a +24.4% average yearly gain.

Visit Zacks


6. IBD Leaderboard: Growth Stock Picking Service

The Investors Business Daily (IBD) Leaderboard service provides research and ratings using the CANSLIM method to evaluate their stock picks. IBD’s highest-rated stocks are ranked using the following criteria: Current Earnings, Annual Earnings, New Products, Supply, Leaders, Institutional Sponsorship, and Market Direction.

Investors Business Daily (IBD) has driven its business to digital-first over the past years. But they do still provide a print newspaper service. Investors Business Daily is available as a digital and print subscription.

Investors Business Daily: Stock Research & Trading Plans

The Leaderboard services cost $828 per year, which is more expensive than Motley Fool, Stock Rover, and MorningStar. To justify this additional cost, IBD claims that they have a performance record of an average 36.6% profit per year. If this is the case, it could be well worth the investment. You can track watchlists, a regular market commentary email, and excellent charts with buy and sell signals overlayed as part of the service.

Visit Investors.com


7. Seeking Alpha: High-Performing Stock Picking Service

With over 8 million users exchanging stock advice and research, Seeking Alpha (SA) provides a constant source of ideas. Registration is free, but there is also a premium marketplace for stock advisory services.

What I like about Seeking Alpha is the experience level of the user community. If someone posts a sub-standard research article, the users will point it out in no uncertain terms.

Seeking Alpha Stock Research: Quant Performance

The real benefits to Seeking Alpha are with the Pro Service, which gives you access to all the Investing Ideas and Seeking Alpha’s Premium Ideas. Seeking Alpha PRO includes screening, portfolio management tools, and their crown jewel, the Quant Rating, for $239 annually. The Quant Rating system claims to have an average annualized return of 24%

SA also makes money by allowing others to sell their stock investing strategies through their marketplace, with monthly prices ranging from $25 to $300.

Visit Seeking Alpha


Summary: Top 7 Best Stock Research Services

Stock Rover’s stock and ETF screening are the best I have ever used, allowing you to implement growth, value, and dividend strategies effortlessly. Stock Rover also has excellent real-time research reports and connects to your Broker to deliver excellent portfolio management services. The Motley Fool Stock Advisor Service has a proven track record of stock selection that beats the S&P 500 index.

I personally subscribe to Stock Advisor, and I am a passionate user of Stock Rover. Using the Motley Fool team’s Stock Picking talents combined with the powerful analysis of Stock Rover is, for me, the best approach to building a market-beating portfolio.

Frequently Asked Questions

How to pick stocks for the long term?

A good strategy to pick stocks for long-term investments is to research companies in breakthrough industries with high sales growth and accelerating earnings per share. Ideally, long-term investments will be first to market and have little competition.

Who has the best stock-picking record?

According to our in-depth research, Motley Fool’s Stock Advisor service has the best stock picking record, with 48% of stock picks beating the market with an average gain of 680 percent. Only 28 percent of stocks made a loss averaging 42%, since 2002.

How to pick stocks to invest in?

You can independently pick stocks using growth, dividend, or value investing strategies. To implement these strategies, we recommend Stock Rover. Alternatively, you can opt for a stock picking service like Motley Fool, which has a winning track record in-stock selection.

Are Motley Fool stock picks good?

Yes, Motley Fool stock picks are very good; based on our 20 years of testing, Motley Fool’s stock advisor service came out number one, above Morningstar, Zacks, and Seeking Alpha.

Does stock picking work?

Yes, stock picking does work, but it can be extremely time-consuming. We have developed detailed backtesting of stock picking systems like the Beat the Market system, but for many novice investors, it makes sense to use the Motley Fool Stock Advisor service to save time.

How accurate are motley fool stock picks?

Motley Fools Stock Advisor Service is very accurate; based on our testing, Motley fool has a 72 percent win ratio, with an average win of 680% since 2002. 28 percent of their stock picks made a loss averaging 42 percent.

How do I successfully pick stocks?

To pick stocks successfully, you must learn stock investing, particularly fundamental and technical analysis. Fundamental analysis covers financials, industry products, and competition. Technical analysis is stock charts and supply and demand. Alternatively, use a stock picking service like Motley Fool.

How does Warren Buffett pick stocks?


You want to be a successful stock investor but don’t know where to start.

Learning stock market investing on your own can be overwhelming. There’s so much information out there, and it’s hard to know what’s true and what’s not.
Stock Market Investing Training - Liberated Stock Trader Pro

Liberated Stock Trader Pro Investing Course
Our pro investing classes are the perfect way to learn stock investing. You will learn everything you need to know about financial analysis, charts, stock screening, and portfolio building so you can start building wealth today.
★ 16 Hours of Video Lessons + eBook ★
★ Complete Financial Analysis Lessons ★
★ 6 Proven Investing Strategies ★
★ Professional Grade Stock Chart Analysis Classes ★

Find Out More


Source link

#Stock #Picking #Advisory #Services

The Magnificent Seven Stumble: Cracks Appear in Market Titans – Fat Tail Daily

It’s not a stretch to say AI has been the primary driver of the current US stock market rally.

And while that makes the major indices look good, the gains have been far from evenly spread.

If a stock is unrelated to AI, it has been largely left behind as the market touches new all-time highs.

Perhaps that’s why 36% of companies on the S&P 500 mentioned AI in their last quarterly earnings calls.

Everyone wants to bask in the reflected glory of AI!

But the market isn’t easily fooled. Most of the money continues to go into a few big-name tech stocks that are genuine players in the AI race.

The Magnificent Seven, comprised of Apple, Alphabet, Amazon, Meta, Microsoft, Nvidia, and Tesla, led the charge last year.

These combined seven returned 107% in 2023, doubling the Nasdaq 100’s returns and massively outperforming the S&P 500’s 24% gain.

These titans now account for around 30% of the S&P 500 index— a point of historic market concentration.

Source: Goldman Sachs Global Investment Research

But as we approach the tail end of earnings season, the Magnificent Seven are dropping off one by one.

Mike O’Rourke, the chief marketing strategist at Jones Trading who coined the term, thinks the era of the Magnificent Seven is over.

This big rising tide of seven names lift[ing] all boats in the stock market, is what I see ending,’ O’Rourke said. ‘I don’t see these seven names rising together’.

The once Magnificent Seven are now seeing their trajectories split. Through a combination of fierce competition and public missteps, three are being left behind.

Just last week, we’ve seen Tesla [NASDAQ:TSLA] stock fall over -10% as the EV market fights for the shrinking slice of car sales.

Alphabet [NASDAQ:GOOGL] has stepped from one blunder to the next in its attempt to catch up with OpenAI’s ChatGPT.

While Apple [NASDAQ:AAPL] has seen its stock continue to fall as regulation and fierce competition squeeze earnings.

The New ‘Fantastic Four’

Source: TradingView

Whether these share price drops herald a sustained shift away from the remaining ‘Fantastic Four’ remains to be seen.

But this could be the turning point where the market concentration seen in the past 12 months begins to shift.

Markets have historically struggled to broaden beyond the top players, who remain some of the most profitable in the world.

However, when things are stretched, investors will eventually shift to investments that present better value.

Today, the S&P 500’s forward P/E is 23.4, while the equity risk premium (ERP) is only 3.5%.

Historically, this is around 5%, so from a risk-adjusted view, you’re not getting good value in the long term at these prices.

Is this because the market is overheated? Unlikely.

Comparisons to the dot-com bubble miss the clear difference in earnings and cash flow from then to now.

Just compare the top seven Nasdaq stocks’ average P/E at the dot-com peak to the end of 2023.

Source: Ftr-Investors

One has only to open Nvidia’s [NASDAQ:NVDA] blockbuster earnings last month to see a company with real demand and solid earnings.

The day after those earnings, Nvidia added an astonishing US$277 billion to its market cap. That’s the equivalent of a Bank of America or a Chevron in a single session.

But the top-heavy nature of the market has meant that concentration risk is not the only factor at play.

Goldman Sach’s Hedge Fund Trend Monitor shows that 6 of the 10 largest holdings in over 700 aggregated hedge fund portfolios are these ‘Mag 7’ stocks.

Hedge funds, ETFs, and passive traders are crowding around the same portfolio of expensive stocks.

This resembles the 1960s obsession with the Nifty Fifty. The market converged around ‘quality’ stocks, but their best days of growth were behind them.

The Nifty Fifty ultimately flatlined for nearly two decades.

That’s not to say the Mega caps won’t perform from here. It’s just that smaller caps will simply catch up.

The possibility of soft landing and interest rate cuts by mid-2024 presents an opportunity for market broadening.

Interest rate relief will allow smaller cap’s earnings and margins to flesh out in the second half of this year.

This and an open field of disruption with tech like AI, should mean smaller players shine again.

However, picking the smaller caps requires a deeper understanding of what went wrong with the bigger players this year.

The Stumbling Three: Apple, Alphabet, and Tesla

Now, these are truly global stocks that defy oversimplification in many ways.

But I will press on with a series of themes that can be taken to investing in smaller tech stocks.

Lesson #1 Walled Gardens Crumble

In May of last year, a leaked memo, allegedly from a Google researcher, circulated within AI circles and caused a stir. It started with:

We Have No Moat: And neither does OpenAI


We’ve done a lot of looking over our shoulders at OpenAI. Who will cross the next milestone? What will the next move be?


But the uncomfortable truth is, we aren’t positioned to win this arms race and neither is OpenAI. While we’ve been squabbling, a third faction has been quietly eating our lunch.


I’m talking, of course, about open source. Plainly put, they are lapping us…


…While our models still hold a slight edge in terms of quality, the gap is closing astonishingly quickly. Open-source models are faster, more customisable, more private, and pound-for-pound more capable.


They are doing things with $100 and 13B parameters [AI size] that we struggle with at $10M and 540B. And they are doing so in weeks, not months.

Now, I won’t guess the memo’s origin, but I will discuss its relevance to the Big Seven.

The closed ecosystems that have defined companies like Apple and Google in the past are starting to fall away.

Apple’s brilliant marketing meant consumers looked past their overpriced hardware into something that meshed design and aesthetics in holy matrimony.

But its closed system and ‘cult of product’ have pushed it into a corner where it struggled to maintain those lofty product expectations.

It’s also restricted them from innovating as fast as their competitors, who all add value to open-source ecosystems like Android.

Last week, the EU punished Apple for its closed approach, issuing a nearly US$2 billion fine for anti-competitive behaviour on its app store.

The EU also pushed through a landmark law that will open all the major tech titans to new competition.

It’s also scrapped its US$1 billion EV project and has yet to find a new product that has captured consumer attention.

Some may point to the Apple Vision Pro as its next big frontier. For now, it’s too early to tell if AR/VR is really a mainstream product.

Initial sales point to serious competition from Meta’s [NASDAQ:META] Quest 3.

Why? Because Meta’s product already has a robust ecosystem of open-source features at one-seventh the price.

Newer markets like Virtual Reality or AI aren’t going to replicate the iPhone era of old.

If Apple can no longer keep people engaged within its systems, it will continue to bleed sales to competitors.

The lesson here is if companies want to maintain their growth, they’ll need to do so in open ecosystems where developers and customers reside.

Lesson #2 Respect Your Customers  

The flubs and outright fabrications of Google’s Gemini launch have raised worries about Google’s market position.

The recent hot-button issue of Gemini creating racially biased images has certainly garnered the attention of the media and investors.

Companies like Google have seen pushback from consumers fed up with paternalistic behaviour.

In a rare public appearance over the weekend, Google co-founder Sergey Brin acknowledged the recent mistakes, saying the company ‘definitely messed up’.

Meanwhile, CEO Sundar Pichai described the results as ‘completely unacceptable’.

This came not long after Gemini’s first major misstep —and greater sin, in my opinion— when the company was forced to admit its initial ‘hands-on’ video of Gemini was a fabrication.

Google later claimed the staged six-minute video represented ‘what Gemini could look like’ and was intended to ‘inspire’ rather than misinform.

The market disagreed.

A similar story is playing out with top talent at the Magnificent Seven. After rounds of layoffs at the big firms, burnout and lack of agency have hit a tipping point.

The eye-watering salaries are no longer enough to hold talent.

Since September, Google has lost four lead developers of Gemini, and similar exits have occurred across others.

This exodus of top developers and mass layoffs has spread the seeds of the next generation of scrappy AI startups backed by aggressive VC capital.

And this sea change brings us to my last point.

Lesson #3 No Moat is Unbreachable

The poster child of growth Tesla [NASDAQ:TSLA] has finally faced the reality that its once green fields are now filled with fierce competitors.

Many of these are Chinese EV upstarts. Fuelled by $57 billion in state subsidies, which from 2016–2022, pushed China to become the world’s biggest EV producer.

Combined with China’s stranglehold on battery mineral refining and production, price competition has squeezed out Tesla’s margins.

Despite still managing 19% sales growth in 2023, Tesla’s gross profits fell 15% amid a 5pp drop in gross margins.

The average revenue per vehicle sold has fallen from a peak of US$57,300 in Q2 2022 to just US$44,500 in Q4 2023.

Tesla was once thought to have a sizable technological moat. Their future promises of self-driving cars and big data services set them apart.

 As Elon Musk famously quipped:

If you buy a Tesla today, I believe you are buying an appreciating asset, not a depreciating asset.

Those sentiments have now evaporated faster than the resale value of a Tesla Model 3.

The lesson is illustrative when looking at other Magnificent Seven members.

Whether that’s Google’s near 90% stranglehold on search or Amazon’s control over the cloud.

Competition is heating up.

There is no doubt that these companies led an incredible market run, but when market cycle leaders start to underperform, it’s a sign that trends are starting to shift.

Looking ahead, I see a market that favours stock picks over passive investing.

But that will require more discernment from investors who want to follow the AI wave to its next shores.

Regards,

Greg Canavan Signature

Charlie Ormond,
For Fat Tail Daily

With over a decade of fintech experience, including stretches in critical roles at budding startups and tech titans like Microsoft, Charlie is squarely focused on investment opportunities in emerging sectors. Interestingly, his academic foundation in zoology provides an unexpected edge! He applies his scientific training with his analytical mindset to figure out tomorrow’s winners and losers. While traditional institutions stick with ‘safe’ stocks, Charlie goes straight for seismic shifts in crypto and AI. He’s an early adopter of both technologies.

Now he’s on a mission to empower everyday investors. He decodes groundbreaking developments in technology stocks before they grab mainstream attention. So, if you seek an unconventional perspective to help capitalise on what’s next in fintech: look no further.

All advice is general advice and has not taken into account your personal circumstances. Please seek independent financial advice regarding your own situation, or if in doubt about the suitability of an investment.

Source link

#Magnificent #Stumble #Cracks #Market #Titans #Fat #Tail #Daily

Sapphire Strat Maker – Documentation

[0] Expert Advisor Magic Defines the expert advisor magic number, which uniquely identifies deals/trades executed by this EA. [0] Expert Advisor Trading symbol Symbol in which trades will be executed. If no value is set, the defined strategy tester or chart symbol is defined. This is useful when operating on non-tradeable futures historical series or if your strategy demands acquiring data from one symbol (defined in the ST or in the chart), but trades on another one. [0] Expert Advisor Get underlying symbol Gets the underlying symbol for the brazilian futures series (WIN and WDO). Only works in brazilian market. Should be set to false in ANY other case to avoid errors. [0] Expert Advisor Note N Set observations to this specific EA. This is not used for the stategy and has no effect in the EA whatsoever. [1] Trading Settings Trading mode Defines if the EA will have only one position at time or if it is allowed to open multiple positions whenever a new buy/sell signal is received.  [1] Trading Settings Indicators timeframe Defines the global timeframe for indicators. This can be overriden in the specific indicator timeframe settings. [1] Trading Settings Use start time Defines if  Start time  condition is allowed to be checked. [1] Trading Settings Use end time Defines if  End time  condition is allowed to be checked. [1] Trading Settings Use close time Defines if  Close time  condition is allowed to be checked. [1] Trading Settings Start time Sets the start time so the EA can operate. This  does include  the time set (if you set it to 09h00 and you’re operating on the M1 timeframe, the first candle evaluated will be the 09h00 candle). [1] Trading Settings End time Sets the end time so the EA cannot open any new positions. This  does not include  the time set (if you set it to 15h00 and you’re operating on the M1 timeframe, the EA will still be able to open new positions at 15h00; not anymore at 15h01). [1] Trading Settings Close time Sets the close time so the EA  cannot open any new positions and closes all open positions . This does not include the time set (if you set it to 17h00 and you’re operating on the M1 timeframe, the EA will still be able to open new positions until 17h00  if the end time is not set otherwise ; not anymore at 17h01, time at which all positions will also be closed). [1] Trading Settings Ignore first day bar The EA will not evaluate the last candle of the day before. This means that the first buy/sell condition will be evaluated  after the first candle of the day is closed. [1] Trading Settings Indicator buffer update bars Defines how much data (in bars) shall be retrieved from the indicators. The default value is pretty much enough for most cases, but if you need to retrieve values older than the last 8 bars (including the current opening one), increase this value.
Setting a value lower than the required by the conditions you specify may return an  Array out of range  error. [1] Trading Settings Show indicators on live chart If true, loads the indicators on live chart. [1] Trading Settings Show indicators while testing If true, shows indicators on the strategy tester visual mode. [1] Trading Settings Allow to modify existing trades If  Enable , allows the EA to modify TP and SL levels. This is valid for  any modification of take profit or stop loss , including trailing stops (not implemented) or breakeven (later section).
If  Disabled,  even if any modification option is set, the EA will not modify the defined TP or SL when the position was opened. [1] Trading Settings Reference price for TP/SL Defines the reference price to define take profit/stop loss in the  Fixed  mode. This is important to assure that strategy tester results are closer to the expected in real trading.
– TP/SL from current open  states that take profit/stop loss is calculated from the current open price (default; this ensures the better results, because the position is  always  executed at the first tick of a new candle, i.e., the current open price);
– TP/SL from last close  states that take profit/stop loss is calculated from the last close price (may be misleading, since the current open may not be equal to the last close in certain cases, specially in swing trading);
– TP/SL from bid/ask states  that take profit/stop loss is calculated from the bid/ask (this would be the best option; however, bid/ask may differ a lot in strategy testing. Also, in real trading, this can put your tp/sl levels way above/below the desired level in a way that the order would be executed in the backtesting, but not in a real trading). [2] Tester Settings Test type If the strategy tester optimization criteria is  Custom Max , it returns the defined value in this variable.  Always prefer Custom Max and define the optimization method this way, so the optimizing tests are faster if you define any of the subsequent parameters. [2] Tester Settings Allow functions on mode Allows  Max Drawdown ,  Max trades ,  Max trade by trade drawdown   and  Max absolute balance loss  on the specified testing mode. [2] Tester Settings Max drawdown (%) Defines the maximum drawdown. If the EA detects a bigger drawdown, it immediately stops testing,  significantly increasing the test speed. [2] Tester Settings Max trades Defines the maximum number of trades. If the EA detects more trades, it immediately stops testing,  significantly increasing the test speed. [2] Tester Settings Max trade by trade drawdown Defines the maximum trade by trade drawdown (i.e., consecutive losses drawdown). If the EA detects a bigger trade by trade drawdown, it immediately stops testing, significantly increasing the test speed. [2] Tester Settings Max absolute balance loss Defines the maximum balance loss. If the EA detects an absolute drawdown more than the specified value, it immediately stops testing, significantly increasing the test speed. [2] Tester Settings Withdrawal condition If the user wants to simulate withdrawals while testing, set this condition to any value except  None .
  Withdraw   Daily, Weekly  and  Monthly  makes withdrawals every defined period;
  Withdraw when balance is bigger/lower than  makes withdrawals if balance is bigger/lower than the value in the variable  Reference money to withdraw . [2] Tester Settings Reference money to withdraw Defines the reference money to start withdrawing (example: if  Withdrawal condition   is  Withdraw when balance is bigger than  and  Reference money to withdraw   is 10.000, withdrawals will be made once a day, in the first candle, before the first trade, whenever the balance is bigger than 10.000). [2] Tester Settings Withdrawal amount Defines the amount to withdraw. [2] Tester Settings Deposit condition If the user wants to simulate deposits while testing, set this condition to any value except None.
  Deposit   Daily ,  Weekly  and  Monthly  makes deposits every defined period;
  Deposit when balance is bigger/lower than  makes deposits if balance is bigger/lower than the value in the variable  Reference money to deposit . [2] Tester Settings Reference money to deposit Defines the reference money to start deposition (example: if  Deposit condition  is  Deposit when balance is lower than  and  Reference money to deposit  is 10.000, deposits will be made once a day, in the first candle, before the first trade, whenever the balance is lower than 10.000). [2] Tester Settings Deposit amount Defines the amount to deposit. [3] Indicators [3.N] Indicator Desired indicator from the list. The  N  indicates the index of the indicator which will be used in the signals/profit levels/trailing stops (0 = index 0, 1 = index 1, etc., up to 9 = index 9). [3] Indicators [3.N] Path to custom indicator Sets the path to the custom indicator (it must be at  MQL5Indicators ). [3] Indicators [3.N] Indicator timeframe Timeframe at which the indicator will be launched. If this value is other than  current,  it  overrides  in the global  Indicators timeframe  input defined in the  [1] Trading Settings   section. [3] Indicators [3.N] Param 1 1st indicator parameter. If it’s a custom indicator, this parameter  MUST  be the amount of buffers in the indicator, and the 2nd parameter is actually the 1st parameter of the indicator and so on. [3] Indicators [3.N] Param 2 2nd parameter. [3] Indicators [3.N] Param 3 3rd parameter. [3] Indicators [3.N] Param 4 4th parameter. [3] Indicators [3.N] Param 5 5th parameter. [3] Indicators [3.N] Param 6 6th parameter. [3] Indicators [3.N] Param 7 7th parameter. [3] Indicators [3.N] Param 8 8th parameter. [3] Indicators [3.N] Param 9 9th parameter. [4] Entry signals Allow buy signals Allow to open buy positions. If  false , no buy positions will be opened. [4] Entry signals Allow sell signals Allow open sell positions. If  false , no sell positions will be opened. [4] Entry signals Buy signals filling mode Filling mode for buy signals.
If  Fill all conditions , all defined conditions must be simultaneously met to open a new buy position;
If  Fill any conditions , any of the defined conditios must be met to open a new buy position, regardless of the others. [4] Entry signals Sell signals filling mode Read the documentation for  Buy signals filling mode . [4] Entry signals Common signals filling mode Specifically for this parameter, if there are no common signals, this should be set to Fill any condition, otherwise, no position will be opened.
Read the documentation for  Buy signals filling mode .  [4.1] Buy signals
[4.2] Sell signals
[4.3] Common signals
[X.Y] Series to compare Indicates the first series used for comparation. The  X  indicates the number of the signal (since there are the possibility to set 5 signals, it ranges from 1 to 5), mainly used for organization. The  Y  means the value to be compared; there are 2 values per signal, so it ranges from 1 to 2, and value 1 will be compared against value 2. If it results to true, and all other conditions are fullfiled according to the set filling mode, a buy signal is returned.
The series are defined as followed:
– Open, High, Low  and  Close  return the defined series;
  Amplitude  returns the amplitude (distance between high and low) of the candle;
  Amplitude (open-close)  returns the open-close distance (candle body);
– Fixed  returns no series, but a pre-defined user input value set in the input Bar shift/Fixed value;
Indicator  returns an indicator buffer, whose parameteres are defined in the subsequent inputs;
– Tick volume  returns the tick volume series;
– Real volume  returns the real volume series. [4.1] Buy signals
[4.2] Sell signals
[4.3] Common signals
[X.Y] Math operation on series Apply a mathematical operation to the series value with the value set in the variable  Value . It can be one of the following:
– None : no operation is applied;
– Add:  adds the series value to the value defined in  Value ;
– Sub:  subtract the series value by the value defined in  Value ;
– Mult:  multiply the series value by the value defined in  Value ;
– Div:  divide the series value by the value defined in  Value ;
– Highest:  gets the highest value. The start value is defined in the parameter  Bar Shift/Fixed value , while the count to search the highest value is defined by the variable  Value  ( example:  if  Bar Shift/Fixed value  is 1 and  Value  is 7, it will search for the highest value, starting from the bar of index 1 to the bar of index 7, i.e., 7 bars back). If the series is  specifically  defined as  Indicator ,  Bar Shift/Fixed value shall not be higher  than the  Indicator buffer update bars   input, nor the sum of  Bar Shift/Fixed value   and  Value   should be bigger than Indicator buffer update bars input, otherwise, an  Array out of range  error may raise.
Lowest:  gets the lowest value. Behaves exactly as  Highest  parameter.
  Average : gets the simple average of the series. Behaves exactly as  Highest  and  Lowest . [4.1] Buy signals
[4.2] Sell signals
[4.3] Common signals
[X.Y] Value Value to be applied by a mathematical operation, according to the desired input  Math operation to series . [4.1] Buy signals
[4.2] Sell signals
[4.3] Common signals
[X.Y] Indicator index If  Series to compare   is set to  Indicator,  sets the indicator index from which to retrieve data (read  [3.N] Indicator  input for more info.). Has no effect otherwise. [4.1] Buy signals
[4.2] Sell signals
[4.3] Common signals
[X.Y] Indicator buffer If  Series to compare  is set to  Indicator,  retrieves data from the buffer indicated by this input. Has no effect otherwise.
If  Indicator buffer  is set to a value bigger than the amount of buffers of the selected indicator, it may result in an  Array out of range  error. [4.1] Buy signals
[4.2] Sell signals
[4.3] Common signals
[X.Y] Bar shift/fixed value The bar to retrieve data, ranging from 0 to  Indicator buffer update bars  if  Series to compare  is set to  Indicator.
If  Series to compare it is set to anything else, other than Indicator or Fixed, it ranges from 0 to the maximum amount of bars otherwise.
If Series to compare is set to Fixed, this input represents the fixed value. [4.1] Buy signals
[4.2] Sell signals
[4.3] Common signals
[X.Y] Comparison method Defines the comparison method to evaluate the condition. If X.1 compares true against X.2, it may result in a buy signal. [5.1] Order Type —————– Order type is not implemented yet and only orders at market are allowed. Changing input parameters shall have no effect. [5.2] Take Profit
[5.3] Stop loss Update take profit levels
Update stop loss levels If  true , it allows the recalculation of take profit levels.
If the next  Take profit series on both buy/sell   is set to  Fixed , this has no effect.
Otherwise, the take profit level will be updated to the new data of the selected series data.
Example: suppose you the order is opened with take profit on a moving average. Every candle, if this input is true, the take profit will be set to the new moving average value. If this is false, the take profit will remain the same as initially set. [5.2] Take Profit
[5.3] Stop loss Add spread to take profit
Add spread to stop loss Adds the spread to the calculation of take profit and stop loss. This makes the take profit comes closer to the entry price, while the stop loss goes further away. This way we can make easier, by the market conditions, to trigger the TP and harder to trigger SL, but also at the cost of profiting less and losing a bit more. [5.2] Take Profit
[5.3] Stop loss Take profit series on both buy/sell Read the documentation for  [X.Y] Series to compare .
The only difference is the possibility to set this input to  Fixed bars,  which corresponds to closing the position after  N bars  (defined by the input  Fixed take profit/bars ) have passed.  N represents the number of closed bars after a position is opened .
If this is set to  None , then the EA will ignore the next inputs and will search the specific inputs for buy and sell defined right afterwards. [5.2] Take Profit
[5.3] Stop loss Math operation Read the documentation for  [X.Y] Math operation to series . [5.2] Take Profit
[5.3] Stop loss Value Read the documentation for  [X.Y] Value . [5.2] Take Profit
[5.3] Stop loss Indicator index Read the documentation for  [X.Y] Indicator index . [5.2] Take Profit
[5.3] Stop loss Indicator buffer on both buy/sell Read the documentation for  [X.Y] Indicator buffer on both buy/sell . [5.2] Take Profit
[5.3] Stop loss Bar shift/fixed value Read the documentation for  [X.Y] Bar shift/fixed value.
This also is set when  Take profit series on both buy/sell  is set to  Fixed bars  and shall correspond to the amount of bars that have passed to close the position. [5.4] Trailing Stop —————– Trailing stop is implemented, but not documented yet. [5.5.1] Volume Calculation type Method to set the volume for trades. It can be either:
– Fixed:  volume the same as defined in  Default lot/risk (%) input.  It can be changed if you define operations to change volume on a profitable or losing operation. Otherwise, it is always the same.
– Balance percentage %:  volume is calculated based on the  stop loss level  and a percentage of your balance defined by the  Default lot/risk (%) input . Say you have a balance of U$ 10,000.00 and sets the balance percentage volume as 1% of it. That means you want the stop loss to be 1% of your balance. If a tick corresponds, for example, to U$ 1.00 and the stop loss is 10 ticks away from the price, it means you would be risking U$ 10.00 as per minimum volume (let’s say 1 lot). If 1% of your balance is U$ 100.00, then you could trade 10 lots in this operation, so you would risk 1% of your account. [5.5.1] Volume Default lot/risk (%) Parameter set according to the chosen  Calculation type   input. [5.5.1] Volume Operation on loss Mathematical operation in case the last trade is a losing trade. This is ignored in case  Calculation type   is set as  Balance percentage % . [5.5.1] Volume Volume operation value on loss Value of the mathematical operation on loss. [5.5.1] Volume Operation on profit Mathematical operation in case the last trade is a profitable trade. This is ignored in case  Calculation type  is set as  Balance percentage % . [5.5.1] Volume Volume operation value on profit Value of the mathematical operation on loss. [5.5.1] Volume Maximum volume Maximum volume possible after mathematical operations. [5.5.1] Volume Minimum volume Minimum volume possible after mathematical operations. [5.5.1] Volume Reset to init volume on loss Resets the volume set by a mathematical calculation to the initial volume originally defined by  Default lot size   after a losing trade. Has no effect in case  Calculation type  is set as  Balance percentage %. [5.5.1] Volume Reset to init volume on profit Resets the volume set by a mathematical calculation to the initial volume originally defined by  Default lot size  after a profitable trade. Has no effect in case  Calculation type  is set as  Balance percentage %. [5.5.2] Money Stop calculation type Defines the method to calculate the values to stop trading in the period. Currently only  Money  is available, which means that after a certain level of profit/loss is reached, it stops trading until the condition is renewed. [5.5.2] Money Stop trading period Defines the period to stop trading. It can be  Daily, Weekly  or  Monthly. [5.5.2] Money Max profit in the period Sets the maximum profit to stop trading in the period defined by  Stop trading period   input. If set to 0, this parameter is ignored.   [5.5.2] Money Max loss in the period   Sets the maximum loss to stop trading in the period defined by  Stop trading period  input. If set to 0, this parameter is ignored.     [5.6] Breakeven Percent from price  Percentage already moved from the price to trigger the breakeven. Example: the price is at U$ 10.00 and take profit is defined at U$ 11.00. The difference is U$ 1.00. If this input is set at 90%, the stop loss will be moved to breakeven when price reaches U$ 10.90 (90% between opening price and take profit).  

Source link

#Sapphire #Strat #Maker #Documentation

Vantagepoint AI Market Outlook for March 11,2024

Welcome to the Artificial Intelligence Outlook for Forex trading.

VIDEO TRANSCRIPT

Okay. Hello everyone, and welcome back. My name is Greg Firman, and this is the Vantage Point AI Market Outlook for the week of March 11th, 2024. Now, to get started this week, we’re going to go back to our main intermarket correlations here, so we have some idea what’s going on with these markets after a data-fueled week. We had Fed testimony, so let’s look at the actual performance of the S&P 500.

S&P 500 Index

U.S. Dollar Index

We are most certainly not up 1.15% on the week; we are basically flat. We’re barely up anything on the week. As you can see, there’s our opening on Monday and our close on Friday. But for the month, we are up a mere 0.54%. So, we’re also going to work in the VIX here to see if there’s anything going on with the markets that are telling us the equities may not be as strong as what they appear to be.

So, what I’ve done is a comparative analysis to the dollar index. The dollar is down slightly, as we can see, 1.39%, but the dollar is firmly still above its current yearly opening price. Now, if we go back a random 5 days or a random 30 days, we’re not seeing the true performance. The true performance model, because we’re looking to see at the beginning of the month, the end of the month, what buyers and sellers are doing, the main fund. So, as we can see, the dollar is struggling here on a very weak payroll number. It was not good at all; unemployment rate going higher, U6 going higher, things moving in the wrong way. But I firmly believe that that number was leaked, and they knew this, and that caused a spike in gold last week, which we’ll talk about in a minute. But the main thing we want to understand is the true performance of the S&P 500 for the month of March with a proper anchor point. We can see that we’re basically up virtually almost flat on the week and on the month, a mere 5.4%.

DAX versus S&P 500 Index

So, when we look at the global equity markets, we can see that the DAX, basically the same thing. On the month, it’s only up a mere 0.34%. On the week, it’s did slightly better as we come back for five days right here. Then the DAX is up slightly on the week, but not much. Now, the key thing we’re looking for here is to remain above our yearly opening price and more specifically, our T-cross long that’s coming in at 177,516. But again, the DAX, like the S&P 500, is actually struggling here in the month of March. It’s nowhere; neither one of these two are nearly as strong as what you would think, despite that US dollar moving lower.

Treasury Bonds

Now, when we look at the treasury bonds, we can see the treasury bonds firmly responding to that dollar weakness, up 1.97% in the month of March using an accurate anchor point to gauge the performance. If we go back a random 30 days from the 7th or 8th of March, then we’re bringing all; we’re doing is creating lag in our performance, our true performance model, and what we’re further doing is causing confusion as to what the markets, what are these markets really doing? Are they bullish or bearish? So, the treasury bonds immediately responding to that dollar weakness.

CAC 40

Now, when we look at some of the additional European markets, the CAC 40, again, it’s up a mere 0.15%, which essentially mirrors the S&P 500 for our March performance because again, I don’t want to drag whatever was going on in January and February. The last thing we want to do is drag that into March because again, it creates lag and it creates distortion in price in my respectful opinion. But again, the CAC 40 firmly above its yearly opening price. I would argue that this may be a little bit toppy; our T-cross long here coming in at again 7901. We need to hold above that in order to remain long.

FTSE 100

Now, when we look at the FTSE 100, we can see that the FTSE again, not anywhere near as strong as what the CAC 40 and the DAX, the CAC 40 and the DAX are; we can see our yearly opening price on our FTSE here is coming in at about 7755. So, again, we’re below the yearly opening price, the current yearly opening price, and we’ve been below that the entire calendar year, showing that the FTSE, out of the global indices, is one of the weaker ones. But there is one that’s even weaker, which I’ll show in a moment. But we’re holding above our T-cross long, 7642, for the global index traders; this one here looks like it’s getting ready to break down, and I would argue that this is largely based around that strength, which I’ll show in a moment, around the British pound. So, if the pound continues to extend, it’s likely to put additional pressure on the FTSE.

Dow Jones Euro Stoxx 50

Now, when we look at the Dow Jones Euro Stoxx 50, again, firmly above its yearly opening price, its monthly, and our T-cross long, we’ve got 1.15%. So, the Dow Jones Euro Stoxx 50 outperforming the DAX, outperforming the CAC 40 and the S&P 500. And this is what we look for here is to see where the strength is on the global markets.

Nikkei 225

Now again, when I’m looking through these, the Nikkei 225 is actually down 1.28%. This is coming directly in my respectful opinion from the carry trade starting to come unwound. If the market believes the FED is going to cut sooner and more, then they’re starting to get out of that long dollar Yen trade, which is strengthening; it’s causing weakness in the Nikkei, the stronger yen, the weaker Nikkei. Very similar in the US, the stronger dollar, the weaker the S&P and the indexes. But right now, there’s a rationale based around in market correlations why this is happening.

Now, the Nikkei is basically stopped two days in a row right on our T-cross long at 38917. We need to hold above this, and we need that yen weakening, which we may get next week. So, there could be a buying opportunity here on the Nikkei, but I also believe the Bank of Japan could intervene at any time.

Dow Jones Industrial Average

Now, when we look at the Dow Jones, you can see the Dow Jones here. I’ll just bring that up on the month so we can get an, again, an accurate view of what the real performance is in March. And we can’t get that if we drag that something that’s gone on back in, you know, January or February. So, the Dow is actually down 76%. So, the global equities in general all of a sudden don’t look that great anymore, do they? And this is one of the things we have to take into consideration here. But again, we’re holding above our Vantage Point T-cross long that’s coming in at 38,745, and we’re firmly above our yearly opening price.

Russell 2000

Now, the Russell and the NASDAQ, when we look at these, the Russell is actually performing quite well for the week, 1.39%. So, we’re firmly now on the Russell above our yearly opening price at 2048. We’re above our T-cross long at 2049. So, the Russell looks to be performing a little bit better than the Dow and the S&P 500. But we also want to do a comparative to the NASDAQ contracts. The NASDAQ, again, the market’s a little confused by this, but the NASDAQ is actually down 0.2% on the month. Again, this is factual performance, not a rolling performance model that is causing, I believe, is causing confusion as to what the real performance is. So, right now, we’re still above the yearly opening; we’re still above T-cross long. But the NASDAQ 2 is struggling a little bit up here, but I believe we should be able to hold, and the NASDAQ is one of the better indexes to be involved in.

Volatility Index ($VIX)

Now, when we do all of the looking at the global indexes, we do need to look at the VIX to see if it’s validated anything that we’ve just discussed here. And when we look at the VIX, we can see the VIX index in the month of March is actually up 6.79%. So, and we’re challenging the current yearly opening price on that VIX. So again, if we break above 1501 and stay above that, that is going to put pressure, in my respectful opinion, on the global equity markets. But again, if I move this anchor point to just say okay, 5 days or the last 30 days, then this would look completely different. It could actually make it look like it’s having a positive when in actual fact it’s not. So again, we’ve moved above our T-cross long; the we’ve closed at 1508; the yearly opening price is 1501. This is the first time we’ve closed above that yearly opening price in quite some time here, guys. You know, we’d have to go back into January and February to find that. But the main thing is we want to make sure we’re looking at that in actual fact. We did challenge it here back on March the 5th. So now we’re back up here again, and you can see how the market is using the current monthly opening price, not 30 days ago, guys. It has no relevance to anything. The current monthly opening price, the market is clearly buying the VIX off of that level, 1405. So for next week, first of all, we want to make sure we’re staying above 1405. But I think the bigger area that we need to keep an eye on is 151 because that would tell us that stocks are about ready to, if nothing else, start to move towards a corrective move lower across the global indexes, not just the US markets. And that’s what I think most miss.

Bitcoin

Now, when we do the also comparative analysis between the S&P 500 and Bitcoin once again here, guys, Bitcoin could is becoming its own asset class where it’s not as correlated to the equities what it was. It’s not as inversely correlated to Gold. But the performance on bitcoin just in the month of March currently is 11.69%. I believe it’s up over 50 80% on the year also. But the main thing is Bitcoin has been a strong buy going all the way back into October, and the S&P 500 strength and weakness is having very little effect on it. And once again this past week and we worked on this in the Vantage Point live training room using the T-cross long with the current monthly opening price. That monthly opening price is 61,337 was an another excellent buying opportunity on Tuesday of this past week because it’s not a coincidence that it stopped exactly on that number and moved higher. But the Vantage Point indicators, the yearly opening price, the T-cross long, the indicators still said we’re not turning; we’re not going into a trend reversal here. The minimum requirement we would need for a trend reversal is breaking down below the current T-cross long at 60,496 and breaking down below the current monthly opening price at 61,337. But again, if you move the goalpost by going with a random 30 days or a random 5 days of a rolling performance model, you wouldn’t see this and you would miss this opportunity which we did live in the VP live training room because again it’s a very important number. You can see that in the first 3 days of the month, the market Bitcoin just stayed right on that monthly opening and then ultimately broke higher, took a retracement lower back to its starting point and accelerated higher again. So leverage these levels, but if that T-cross long moves above the monthly opening price, I think we’re looking at 880,000 on bitcoin. So also keep this in mind.

Magna International ($MGA)

So now that we’ve had a complete look at all of these markets together, let’s now bring in a quick review of our main Forex pairs and see how the dollar is faring against them. Now, in this scenario, I’ll move over to a different portfolio where I can bring in my main US dollar correlations to our Forex pairs. Now, the MGA stock, this is a very interesting stock, and the only reason I look at it is because it has a 92.34% inverse correlation to the dollar. So, if the dollar is really as weak as what they’re trying to tell us, then this stock would be moving higher. And as you can see, it’s not. It’s struggling against the Vantage Point T-cross long, and it’s been negative on the entire month. This tells me it’s the dollar maybe is not as weak as what they’re telling me. So again, I look at our T-cross long, which is 103.55; we are below that, but that doesn’t mean the trend on the dollar has completely reversed because again, we’re up 1.48% on the dollar per year. The dollar has never been negative on the year. So, the term bullish bearish we have to take that with a bit of a grain of salt and bring in an accurate measurement point because quite frankly, I’m not overly concerned with what went on in 2021, 2022, 2023. I’m concerned on what’s happening in 2024 because that’s the current trading. So right now, the dollar remains positive on the year by 1.48%. That’s a factual statement because I did not look at random dates.

So Magna has not turned positive. So when we do our comparative analysis here, we want to look at things like gold.

Gold

So gold, and again, I think there is a little bit of confusion as to what the real performance on gold here is. Gold has been negative to clarify the entire calendar year until just about a week ago. And even now, it’s only up 4.4%. So I believe there’s going to be significant headwinds up here around the 2200 mark, 2190, but we shall see. Right now, it remains bullish but maybe a little bit overextended. And just maybe that payroll number was leaked on Friday, the previous Friday, because we have seen this in years past. There was the incident at one of the government offices where one of the fund managers called in and said, ‘Oh, can you give me that payroll number from the previous month?’ And the secretary accidentally gave him the number for the current month, two days before it came out. That was only about five years ago. So I suspect maybe something’s a little bit off here. Our predicted differences on gold, they’re starting to separate, they’re showing potentially a little bit of weakness. But gold usually does fare very well between the end of March and mid-May. So it’s perfectly normal for gold to go up. Maybe this is just a little early. So we’ll see how this plays out. But this is not as wrong as what it appears to be. Again, I would be looking for that pink line, the predicted difference, to still be going higher. But gold again only broke above its current yearly opening price just a matter of seven or eight trading sessions ago. So all of the gains that gold has made are basically in the last week and a half, guys. Yes, we could look at it from down here and measurement down here, but it was still negative on the year.

So, our key support here, the T-cross long, is 2053, and our yearly at around 2084. I believe it’s a little lower than that. I’m going to say 2066, but in our software, 2084. We need to hold above that level.

Euro versus U.S. Dollar

Now, when we look at our main Forex pairs, I’ll start with the main one, Euro. So there again, this is a very good retracement here, but I will point out the Euro is currently still down .82% on the year. It has never been positive in 2024. And that’s where using proper anchor points and performance measurement points comes into play because we can say, ‘Wait a minute, you’re saying the Euro is super bullish and it’s been a really good long trade in 2024.’ That’s one of the analysts said, and that’s actually not factual. It’s actually never made money against the US dollar in 2024 and still hasn’t. We would have to clear the yearly opening price at 1.1038. Now, we look pretty good; we’re coming off our T-cross long. But there’s, I would imagine, there is going to be an epic battle at 1.1038. So my job here is just to make you aware of two things: number one, the Euro has never been positive against the US dollar in 2024; selling on rallies has been the preferred strategy. Number two, I’m not convinced the dollar is completely down and out yet, and I believe the central banks may strike back next week and say, ‘No, we’re still higher for longer.’ So again, we’ll monitor this. Our T-cross long is coming in at 1.0849. That’s our major support level. But our major resistance right now is going to be right up here at 1.1038. Be very cautious around that particular level.

U.S. Dollar versus Swiss Franc

When we look at the US Swiss franc, again, the Swiss franc has been unable to make any gains against the US dollar, significant gains. Currently, it’s down 4.05%. I believe the Swiss franc will start making significant gains against the dollar as we get past the latter part of March. So, I believe we are going to start our corrective move lower. We’re below our monthly opening price, 0.8846. We’re now below our T-cross long here at 0.8796. But I think the dollar has just a little bit of life left in it because, as I’ve talked about in previous sessions, that dollar seasonal pattern is strong between mid-February and mid-March. So maybe a little bit more, but these indicators are suggesting we are going lower. And if we’re currently up, if we’re 4% guys off our yearly opening price, then that means we’ve got 4% of downside with short trades here. That’s a very attractive short even with the interest rate differential.

British Pound versus U.S. Dollar

Now, when we look at the British pound, the British pound currently, from a factual standpoint in 2024, is the only currency that is up against the dollar because it’s positive on the year. You can’t say something is bullish when it’s negative on the year or it’s never made any money on the year, not that the British pound hasn’t tried, but you can see there’s been multiple failures at the current yearly opening price. So we’ve managed to clear this; we’re closing up around 1.2859. But this is a… the British pound has made strong gains. If you go back to what I discussed about the FTSE 100, that explains why the FTSE is one of the indexes that’s below its yearly opening because they’re not going into the FTSE; they’re going into the British pound. So the British pound, pretty easy to figure out. Our supports are T-cross long 1.2697, and more specifically, 1.2732. As long as we’re above this area, the British pound can extend higher. But we need to hold above that level. But again, pointing it out, that is the only currency that is actually making gains against the dollar based around that current yearly opening.

U.S. Dollar versus Japanese Yen

The dollar-yen remains… the dollar remains strong at 104.17. We can see a direct intermarket correlation here, guys, between the Swiss franc and the Japanese yen. If one falls, so does the other. So right now, the dollar is starting to… we’re starting with the first crack in the dam here is the British pound moving above its yearly opening price. We know we’re getting dollar weakness this year, guys. It’s just a timing issue. And it looks like we’re starting to extend lower here. Now, that monthly 149.98, our T-cross long, 149.44. As long as we’re holding below those two areas, then we’re likely going to start trying to make a run towards this 141 area. But I will point out again, the dollar is still positive against the yen.

U.S. Dollar versus Canadian Dollar

When we look at the US-Canadian pair, again, I think we forget that the Canadian dollar has not made any gains against the US dollar, despite this choppiness, the up and down, up and down, five days, 30-day rolling performance. Keep it simple, guys. When we look at this right now, the dollar is still doing well. If we measure it from the start of the year off the yearly opening price to where we are on Friday, once again, we can see the performance of the US dollar directly. And that performance is still up 1.65% against the Canadian dollar. Our T-cross long, 1.3519. That is our key level, along with our monthly opening at 1.3579. These areas here provide you with specific selling opportunities or if you’re a buyer, we need to get above these levels in order for this to extend, which I think will be difficult at this particular time.

But the main thing is, to this point in the presentation, we’ve only seen one currency that’s actually made… is positive on the year if you bought it against the US dollar, and that is the British pound.

Australian Dollar versus U.S. Dollar

If we look at the Kiwi and the Aussie, we see something very similar here. We’re down 2.74%. Yes, the Aussie is coming off strong off its monthly opening price, and yes, we have crossed over our T-cross long. So we use those levels below there for buying opportunities in anticipation of dollar weakness. But again, I need to point this out: the Aussie has not made… has not been able to make any positive gains against the dollar above that yearly opening price, which makes the Aussie one of the weakest currencies in 2024, along with all of the other ones I’ve mentioned.

New Zealand Dollar versus U.S. Dollar

When we look at the Kiwi, we see the same thing. It’s down 2.19% from the… this in the… in the… in the… 2024 calendar trading year. It’s very important that we understand that so we can gauge where we’re at. The yearly opening here, 0.6318, and yes, we’ve closed above our T-cross long. And if we connect the dots between this and the seasonal pattern of dollar strength ending by mid-March, then there is opportunity throughout these markets, throughout all of these particular markets because, again, nothing goes straight up and nothing goes straight down. And with that, we’ll always have opportunity. So, with that said, this is the Vantage Point AI Market Outlook for the week of March the 11th, 2024.


Source link

#Vantagepoint #Market #Outlook #March

Stock Market Crashes: History, Cause, Effect & Fixes

The history of stock market crashes starts with the South Sea Bubble in the early 1700s and ends with the stock market crash of 2022. Our research suggests the causes of crashes are asset bubbles, easy access to cheap credit, weak regulation, and poor institutional risk management.

Learn the complete history and causes of stock market crashes; it might make you a wiser investor.

Stock Market Crashes: History, Cause, Effect & Fixes

6 Stock Market Crashes in Numbers

The 1929 crash was the worst of all, declining 89% in 3 years and taking 23 years to recover fully. The quickest, most severe crash was in 2000, dropping 38% in 30 days, followed by 1987 with -35% in a single month. The 2000 dot com crash was also huge; the NASDAQ dropped 83% in 2 years and took 16 years to recover.

Stock Market Crash Size of Crash % Crash Duration (Months) # Years to Recover
1929 -89% 36 23
1973 -46% 24 10
1987 -35% 1 2
2000 -83% 24 16
2008 -54% 16 5
2020 -38% 1 1
Average -57% 17 9.8

A Timeline of Historical Stock Market Crashes

The last 100 years have seen the 1929 crash and great depression, the 1973 Oil Crisis, 1987’s Black Monday, the 2000 Dotcom crash, the 2008 financial crisis, the 2000 Covid Crash, and finally, the 2022 crash.

Chart: 100 Years of Stock Market Crashes

The History Of Stock Market Crashes

1720 The South Sea Bubble

The South Sea Bubble was a major financial crisis in 1720 after the South Sea Company, an English joint-stock company, was granted exclusive rights to trade with Spanish colonies in the Americas. The company issued large amounts of stock and bonds and enticed investors to buy them by offering generous dividends.

The South Sea Company promised incredible trade and profits to its investors; however, this did not come to fruition. Instead of carrying out trade, the company served almost exclusively as a bank. It loaned money to potential buyers who kept up the demand for their stock and consequently drove up the price of shares – creating an ‘equities bubble.’ It is estimated that more than twice the amount of available stock was sold to a desperate public. The money from these new investments was then used to pay large sums to existing shareholders – many have described it as the first-ever Ponzi scheme.

As investors hoped for quick profits from the stock, the bubble quickly burst, and prices crashed as investors sought to sell their overvalued stocks.

The effects of the South Sea Bubble

The effects of the South Sea Bubble on people were severe—the economic repercussions spread throughout Europe, leading to a major economic recession. Many investors lost their fortunes as the stock prices plummeted, and many saw their debt levels skyrocket due to over-leveraging to make more money from the bubble. People who had trusted and invested in the South Sea Company were left with almost nothing.

1929 & The Great Depression

A breakdown in investor confidence caused the 1929 stock market crash. The Dow had risen by over 503% in the previous nine years, led by the general public’s unrestricted access to credit, which they used to buy stocks on margin. High unemployment and an unregulated, unsustainably high stock market led to a collapse in confidence, which caused the stock market crash.

The 1929 stock market crash was largely caused by people borrowing too much to buy stocks (leverage), leading to heavy selling when prices dropped. This created a snowball effect, causing the stock market to crash and leading to high unemployment and poverty.

The 1929 Stock Market Crash in Numbers

The 1929 stock market crash and subsequent depression was the longest recession in history, lasting 23 years. The Dow Jones Industrial Average lost 89% of its value in 3 years and took 23 years to recover, causing widespread poverty, debt, and homelessness.

Stock Market Crashes Chart: The 1929 Stock Market Crash Lost 89% in 3 Years & Took 23 Years to Recover.

The increase in production output due to World War II gave economists valuable lessons in stimulating economies out of recessions.

What Caused the 1929 Crash?

The cause of the 1929 stock market crash was an asset and equity bubble driven by the general public’s unrestricted access to credit. Easy access to credit fueled a wave of highly speculative and risky investments in the stock market. Eventually, prices were unsustainably high, and the overheated stock market crashed.

The 1929 stock market crash was largely caused by people borrowing too much to buy stocks (leverage), leading to heavy selling when prices dropped. This created a snowball effect, causing the stock market to crash, leading to high unemployment and poverty.

What Has Been Done To Avoid The 1929 Crash in the Future?

Since the 1929 stock market crash, several measures have been taken to help prevent a similar disaster. The most notable action has been the introduction of the Securities and Exchange Commission (SEC), created in 1934 to ensure fair practices and accurate disclosure in the securities markets. The SEC has since introduced various regulations that require companies to provide investors with necessary financial information and protect them from fraudulent activity.

The Federal Reserve has also taken steps to help prevent a similar crash by regulating the money supply and influencing interest rates. The Fed also has increasingly stringent requirements for banks regarding their lending practices, which has helped to reduce risk-taking in the financial markets.

In short, the introduction of market regulators and legislation to ensure accounting transparency and the limitation of credit risk were the major steps taken to avoid another great depression.

1929 Crash Documentary

1973, the Oil Shock

In October 1973, OPEC (Organization of Arab Petroleum Exporting Countries) declared an oil embargo on countries supporting Israel during the Arab-Israel Yom Kippur War. This was an attempt to exert political influence on Western nations, who were highly dependent on Middle Eastern oil. This led to a global economic shock wave.

The 1973 Oil Crisis In Numbers

The 1973 Oil Crisis caused a crash that wiped out 46% of the Dow Jones Industrial Average in 2 years, and it took 10 years for the index to recover from the loss.

Stock Market Crashes Chart: The 1973 Stock Market Oil Crisis Crash Caused a 46& Loss in 2 Years, Which Took 10 Years to Recover.

What Caused the 1973 Oil Shock?

A combination of factors caused the 1973 Oil Shock. The most significant contributing factor was the decision by the Organization of Petroleum Exporting Countries (OPEC) to reduce oil production and raise prices. This decision was taken as a response to the United States supporting Israel during the Yom Kippur War between Arab states and Israel in October 1973. OPEC’s position was that reducing production would lead to higher energy costs for Western countries, making them less likely to support Israel.

In addition to the OPEC decision, other factors contributed to the Oil Shock. These included increased global demand for oil due to economic growth in the 1970s, production disruptions caused by unrest in Middle Eastern countries, and an embargo imposed by Arab nations on oil exports.


You want to be a successful stock investor but don’t know where to start.

Learning stock market investing on your own can be overwhelming. There’s so much information out there, and it’s hard to know what’s true and what’s not.
Stock Market Investing Training - Liberated Stock Trader Pro

Liberated Stock Trader Pro Investing Course
Our pro investing classes are the perfect way to learn stock investing. You will learn everything you need to know about financial analysis, charts, stock screening, and portfolio building so you can start building wealth today.
★ 16 Hours of Video Lessons + eBook ★
★ Complete Financial Analysis Lessons ★
★ 6 Proven Investing Strategies ★
★ Professional Grade Stock Chart Analysis Classes ★

Find Out More


Ultimately, the cause of the 1972 stock market crash was geopolitics and market disruption. The Oil embargo severely disrupted Western economic output and caused a massive correction in the valuation of companies dependent on oil, which was essentially most of the economy.

1973 Oil Shock Documentary

What Has Been Done To Avoid The 1973 Crash in the Future?

To avoid a repeat of the 1973 Oil Shock, several measures have been taken at both global and regional levels. On a global level, the International Energy Agency (IEA) was created in 1974 to coordinate energy policies among its members. The IEA’s mission is to help ensure global energy security by monitoring and responding to energy market developments.

Countries have taken various measures at a regional level, such as forming alliances to protect their interests in an oil-related crisis. The Arab League, for example, was formed in 1945 to represent the interests of its member states and protect them from external aggression.

Western governments invested heavily in decreasing dependence on imported oil; for example, Henry Kissinger unveiled the “Project Independence” program, which by 1981 meant that reliance on OPEC was diminished.


You want to be a successful stock investor but don’t know where to start.

Learning stock market investing on your own can be overwhelming. There’s so much information out there, and it’s hard to know what’s true and what’s not.
Stock Market Investing Training - Liberated Stock Trader Pro

Liberated Stock Trader Pro Investing Course
Our pro investing classes are the perfect way to learn stock investing. You will learn everything you need to know about financial analysis, charts, stock screening, and portfolio building so you can start building wealth today.
★ 16 Hours of Video Lessons + eBook ★
★ Complete Financial Analysis Lessons ★
★ 6 Proven Investing Strategies ★
★ Professional Grade Stock Chart Analysis Classes ★

Find Out More


1987 Black Monday

The 1987 Black Monday crash was a major financial market crash on October 19th, 1987. It is widely considered the largest one-day stock market crash in history, with the Dow Jones Industrial Average (DJIA) plummeting 22.6%. The crash began shortly after the opening bell and continued throughout the day.

1987 Black Monday In Numbers

The 1987 Black Monday Crash was extremely aggressive, dropping 35% in 4 weeks, but it recovered relatively quickly compared to other crashes, taking only two years.

Chart: 1987 Stock Market Crash (Black Monday) 
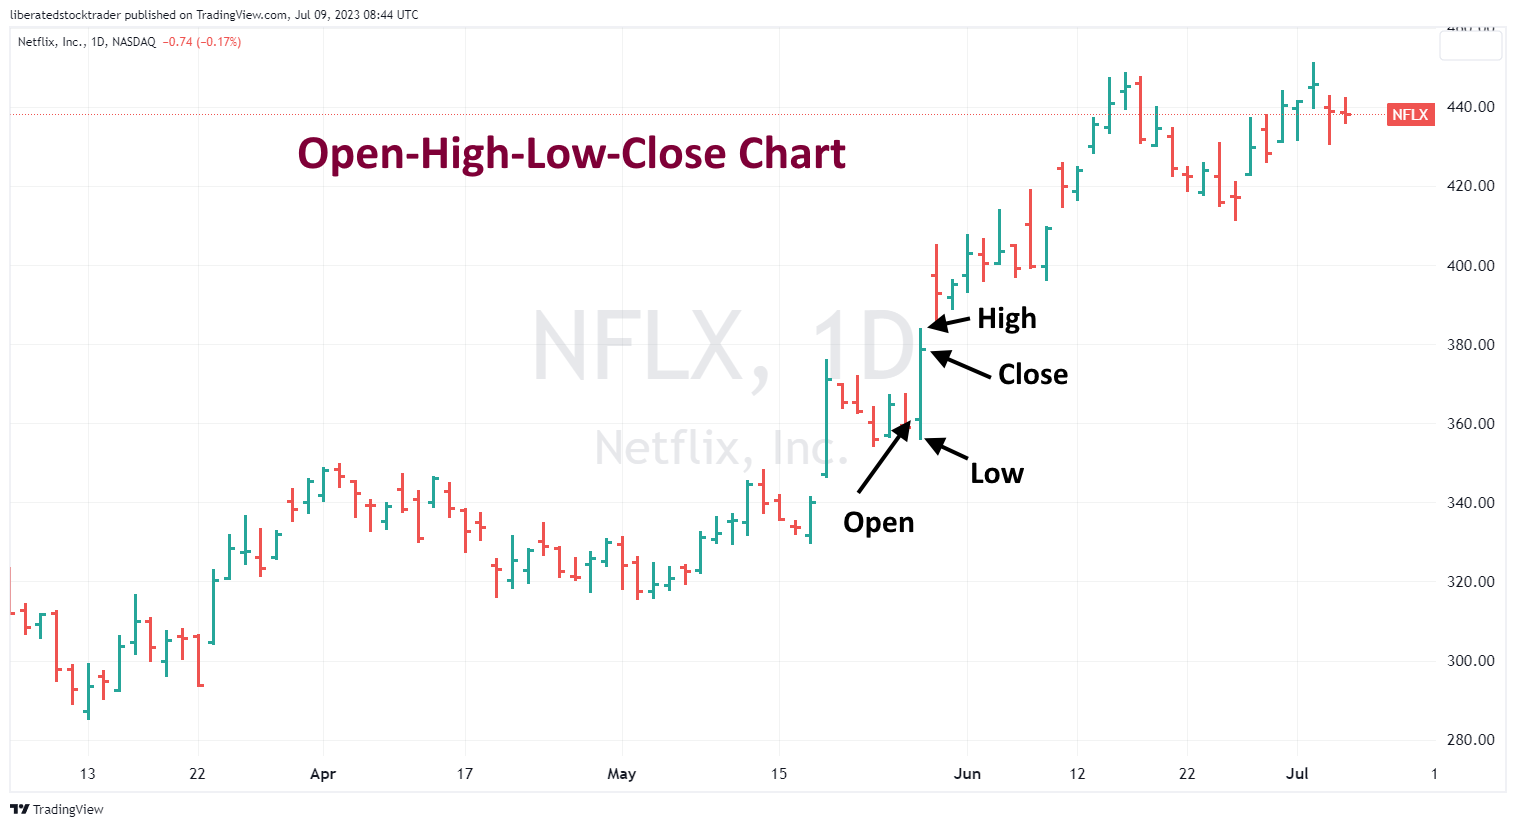
Dropped 35% in 4 weeks, and recovered in 2 years.
Chart: 1987 Stock Market Crash (Black Monday) Dropped 35% in 4 weeks and recovered in 2 years.

What Caused the Stock Market Crash of 1987?

The crash was caused by a combination of factors, including excessive speculation in stock markets, high levels of debt and leverage, the overvaluation of stocks following a decade-long bull market, and a sudden sell-off of stocks driven by computerized trading programs. The crash also highlighted the need for regulation in financial markets, leading to new rules that limited the ability of traders to make large bets with borrowed money and placed restrictions on short selling.

Most experts agree that investors saw the market as overvalued, trading at a PE Ratio of 23. After a strong bull market in the 1980s, there was already considerable fear. Understanding market sentiment, fear, greed, and psychology is important when investing in the stock market. When confidence is lost, it can produce a cascading effect of extreme panic selling.

What Has Been Done To Avoid The 1987 Crash in the Future?

The lessons learned from the 1987 crash led to the introduction of trading curbs. These are essentially circuit breakers that halt trading when there is exceptional volatility and losses in markets. These have been used many times in future crashes and help mitigate extensive losses by introducing a cooling-off period to help dissipate the fear emotions in the market.


Beat The Market, Avoid Crashes & Lower Your Risks

Nobody wants to see their hard-earned money disappear in a stock market crash.

Over the past century, the US stock market has had 6 major crashes that have caused investors to lose trillions of dollars.

Moses Index ETF Strategy

The MOSES Index ETF Investing Strategy will help you minimize the impact of major stock market crashes. MOSES will alert you before the next crash happens so you can protect your portfolio. You will also know when the bear market is over and the new rally begins so you can start investing again.

MOSES Helps You Secure & Grow Your Biggest Investments
★ 3 Index ETF Strategies ★
★ Outperforms the NASDAQ 100, S&P500 & Russell 3000 ★
★ Beats the DAX, CAC40 & EURO STOXX Indices ★
★ Buy & Sell Signals Generated ★
MOSES Helps You Sleep Better At Night Knowing You Are Prepared For Future Disasters

Find Out More


2000 DotCom Crash

The 2000 dotcom crash was a major financial market crash during the early 2000s. It was marked by a sharp decline in stock prices and market values on technology-related stocks, leading to significant investor losses. The crash was caused by various factors, including the overvaluation of tech stocks resulting from speculation and overly optimistic predictions, the inflated salaries of tech executives, and a shift in investor sentiment away from technology stocks. The crash resulted in significant losses for investors, with the Nasdaq Composite Index losing 83% of its value between March 2000 and October 2002. It also raised questions about the role of regulation in financial markets.

The DotCom Nasdaq 100 Crash in 2000 In Numbers

The internet bubble was a big crash for the NASDAQ, with an 83% loss over three years. The NASDAQ took over 16 years to recover from the crash.

Stock Market Crashes Chart: Stock Market Crash 2000 - DotCom Crash Nasdaq 100 Chart
Stock Market Crashes Chart: Stock Market Crash 2000 – DotCom Crash Nasdaq 100 Chart

In comparison, the Dow Jones Industrial Average only dropped 37% over 34 months and took 6.6 years to recover. This was very much an “Internet Stocks” crisis, but it still impacted the broader market.

Stock Market Crashes Chart: Stock Market Crash 2000 - DotCom Crash DJ-30 Chart
Stock Market Crashes Chart: Stock Market Crash 2000 – DotCom Crash DJ-30 Chart

What Caused the Stock Market Crash of 2000?

From 1993 to 2000, modern web browsers and the World Wide Web enabled new ways of doing business, primarily bypassing traditional retail business models and cutting costs. This disrupted the established business models of “Bricks and Mortar” businesses. The aggressive push of new internet businesses to claim market share resulted in companies running at huge losses to dominate the web.

Investors rushed to buy stocks of internet-related companies, regardless of the company valuation. With a huge wave of investment, stock prices soared to unsustainable levels. The NASDAQ 100 rose 400% and reached a Price-Earnings Multiple of 200, which has never been seen before. With investment banks such as Citigroup and Merrill Lynch pumping the market and analysts proclaiming, “Bricks & Mortar companies are dead,” the bubble was complete.

“The collapse of the Internet bubble, perhaps one of the largest financial fiascoes in US history, came after three years, starting in January 1997, when investors would buy almost anything even vaguely associated with the Internet, regardless of valuation. Investors ignored huge current losses and were willing to pay 100 times the expected earnings in fiscal 2002. They were goaded by bullish reports from sell-side securities analysts and market forecasts from IT research firms, such as IDC, Gartner, and Forrester Research.” Source CNN Money November 2001

In 2000, it became clear that many internet companies were burning cash fast, and bankruptcies began. This coincided with the Federal Reserve hawkishly increasing interest rates to help to cool an overheating economy. With interest rate hikes and high bankruptcies, confidence collapsed, and so did the NASDAQ 100, which lost 83% in 2 years and took ten years to recover.

Interestingly, the brick-and-mortar companies listed on the NYSE also suffered from the crash, with the DJ-30 losing 34% in 34 months and taking 6.5 years to recover.

2000 Dot Com Crash Documentary

What Has Been Done To Avoid The 2000 Crash in the Future?

Laws and regulations regarding the full disclosure of risk and tightened rules on conflict of interest declaration have impacted the market. There was also a string of litigation against executives of companies involved in high-profile scandals, including Enron, Worldcom, and Andersen Consulting.

2008 Global Financial Crisis

The 2008 global financial crisis began with the United States housing bubble bursting in 2007. This caused home prices to drop rapidly and increased mortgage defaults, foreclosures, and losses for lenders. These losses quickly spread throughout the banking industry due to complex financial instruments like collateralized debt obligations (CDOs) and mortgage-backed securities (MBSs). These investments were based on high levels of borrowing and risky derivatives, which amplified the losses even further.

The 2008 Financial Crisis Crash In Numbers

The financial crisis was an aggressive crash lasting just 16 months but managed to wipe out 54% of the value of stocks. Due to the decisive central bank and government action, the recovery took five years and was not prolonged more than necessary.

Stock Market Crashes Chart: Stock Market Crash 2008 - Financial Crisis
Stock Market Crashes Chart: Stock Market Crash 2008 – Financial Crisis

What Caused the Stock Market Crash of 2008?

Due to the weakening of the Securities and Exchange Commission (SEC) and lax financial regulation, banks took excessive risks in mortgage lending practices. The introduction of predatory lending practices, such as sub-prime mortgages, allowed people to buy houses with low initial repayments, but large delayed repayments led to a huge property bubble.

These high-risk loans were hidden in Collateralized Debt Obligations (CDOs) by Citigroup and Merrill Lynch and sold on as investments to banks and funds globally. When the mortgages began to default, there was a string of bankruptcies in the financial sector, including the collapse of Lehman Brothers, which kicked off the worldwide panic and breakdown in confidence.

2008 Financial Crisis Documentary

  • For a great movie that covers the Financial Crisis, watch Inside Job

What has been done to prevent another global financial crisis?

The main response to avoid repeating the 2008 financial crisis was the introduction of the Dodd-Frank Act in 2010. It created large-scale reform and regulatory improvements, including introducing the Financial Stability Oversight Council (FSOC) and better derivatives and shadow banking regulation.

Other measures designed to prevent another financial crisis include enhanced regulation of banks and other financial institutions, improved capital requirements to ensure that banks are more capable of withstanding losses, and the creation of new global standards for banking supervision.


Ever Dreamed of Beating the Stock Market

Most people think that they can’t beat the market, and stock picking is a game only Wall Street insiders can win.
This simply isn’t true. With the right strategy, anyone can beat the market.

Growth Stocks: LST Beat the Market Growth Stocks Strategy

The LST Beat the Market Growth Stock Strategy is a proven system that has outperformed the S&P500 in 8 of the last 9 years. We provide all of the research and data needed to make informed decisions, so you no longer have to spend hours trying to find good stocks yourself.

The LST Beat the Market System Selects 35 Growth Stocks and Averages a 25.6% Annual Return
★ 35 Stocks That Already Beat The Market ★
★ Buy The Stocks & Hold For 12 Months – Then Rotate ★
★ Fully Documented Performance Track Record ★
★ Full Strategy Videos & eBook ★
Take The Pain Out Of Stock Selection With a Proven Strategy

Find Out More


2020 The Covid Crash

The 2020 Covid crash was initiated by a pandemic that caused lockdowns and widespread panic worldwide. Trade ground to a halt, causing supply chain pressure. The outcome was mass unemployment as people could not leave home, and the entire retail and hospitality industry was closed down overnight.

The 2020 Covid Crash in Numbers

The Corona Crash was the most aggressive and shocking, losing 38% in just five weeks. Luckily, the market recovered in record time due to government stimulus and support, taking just ten months to recoup the losses.

Stock Market Crashes Chart: The 2020 CoronaVirus Crash Lost 38% in 5 Weeks, But Only Took 10 Months to Recover.

What Caused the 2020 Covid Crash?

The Covid Crash of 2020 differed from previous crashes because a worldwide virus pandemic, SARS-COV-2/COVID-19, caused it. The measures introduced to fight the virus, especially lockdowns and social distancing, created a surge in unemployment and retail bankruptcies.

The stock market reacted quickly, with a 38% loss occurring in only five weeks, devastating the travel, leisure, and retail industries. Interestingly, the market recovered within ten months due to the rapid reaction of governments and central banks, who supported the unemployed and the industries with massive cash stimulus policies. The US issued $1.9 trillion or 26% of its GDP in stimulus and the EU 11% or €750 billion.

What Has Been Done To Avoid The 2020 Crash in the Future?

Avoiding this type of crash will be difficult as the cause is not financial corruption, lack of legislation, or systemic. This pandemic highlighted the problems with the globalization of supply chains and the world’s reliance on China. Governments and businesses are actively diversifying out of China and increasing self-sufficiency, especially in semiconductor and vaccine production.

The Causes of Stock Market Crashes

The evidence suggests the main cause of stock market crashes is a relaxed monetary policy leading to easy credit access. Combine cheap money with poor institutional risk management and lack of regulatory oversight, and you get asset bubbles ready to burst.

Crash Cause Cause Cause
1929 Equity Bubble Easy Access to Credit Poor Institutional Risk Management
1973 Geopolitics Oil Market Disruption
1987 Equity Bubble
2000 Equity Bubble Easy Access to Capital Poor Institutional Risk Management
2008 Asset Bubble Easy Access to Credit Poor Institutional Risk Management
2020 Global Pandemic Lockdowns Decreased demand for services
2022 Inflation High Employment Easy Access to Credit/Stimulus

5 Biggest Causes of Stock Market Crashes

The analysis shows that 66% of stock market crashes are caused by asset and equity bubbles. In fact, in 3 of the six crashes, ease of access to investment capital or credit was used to fuel the asset and equity bubbles. The unrestricted access to capital was caused by poor institutional risk management. It is a cycle; low interest rates, deregulation of finance, and access to cheap capital lead to equity and asset bubbles.

Only two stock market crashes were unrelated to bubbles: the oil market disruption by OPEC in 1973 caused a deep correction, and the SARS-COV-2 pandemic caused a massive drop in global demand and employment.

So, if you want to be on the lookout for the next crash, watch for these five factors.

1. Equity & Asset Bubbles

The stock market crashes of 1929, 1987, 2000, and 2008 were caused by equity and asset bubbles. One could assert that the real cause of the bubbles was poor institutional risk management and easy access to credit, the effect of which was risky speculation. Economist Robert J. Schiller highlights this in his Nobel Prize-winning book Irrational Exuberance.

2. Easy Access to Credit

Low interest rates and easy access to credit allow economies to expand rapidly and increase demand and wealth generation. But there is a point at which, if not properly managed, all the capital sloshing around an economy needs to be invested somewhere. From market sentiment, fear, and greed, we know that money usually finds a home in the latest hot technologies or industries. In 2008, subprime lending caused a housing asset bubble; in 2000, greed and expectation in internet stocks; and in 1929, high-risk speculation in stocks using margin caused the collapse.

3. Poor Institutional Risk Management

In half of the stock market crashes, poor management of risk by institutions was a major cause. In 1929, the provision of loans for margin trading in stocks fueled the bubble. In 2000, investment banks were responsible for pumping internet stocks and IPOs, which, combined with a lack of government regulatory oversight, caused the bubble. Finally, in 2007/8, irresponsible risk management from investment banks caused asset-backed securities to default because of sub-prime mortgage lending, causing a global financial crisis and a complete loss of confidence.

4. Geopolitics & Market Disruption

Wars, tariffs, and trade embargos contributed to the destruction of wealth, but they only contributed to one major stock market crash in the Western world. However, these remain major issues that hold back wealth creation, unemployment, and much-needed improvements in quality of life in developing nations.

5. Pandemic

The latest crash in 2020 introduced us to a new threat to our way of life: pandemic and disease. While we have paid the price in both lives and economically for our abuse of animals, this problem is only just beginning.

3 Biggest Effects of Stock Market Crashes

We have looked at the causes of stock market crashes, but what about the effects?

1. Financial Loss

Financial losses are usually painful and quick when the market goes through a major correction. Trillions of dollars get wiped off the value of stocks, companies, pension funds, and property. It is like the value disappears, and it is at this point we realize that our economies and wealth are simply based on a foundation of confidence. When that confidence erodes, so does our society and standard of living.

2. Inflation/Deflation

Since 2007, interest rates have been reduced to almost zero; this has helped fuel the recovery needed to restore wealth and boost confidence in the global economy. Low interest rates and vibrant global competition have helped to keep inflation low. We were at a point of price deflation in 2019, and in 2023, we are now facing high inflation.

Economists declared inflation dead, but inflation is rising due to the pandemic and the huge decrease in global production. High inflation over 4% is bad for wealth creation and stock markets. Central banks’ main tool for fighting inflation is to increase interest rates, but if you increase interest rates too much, they cause asset and equity bubbles to burst.

3. High Unemployment

An unfortunate effect of stock market crashes is high unemployment and large increases in homelessness. This can take years to recover fully and causes huge amounts of mental and physical anguish to large swathes of the population.

Are Governments Managing Stock Market Crashes Better?

The positive side to this history lesson on stock market crashes is that governments and central banks are improving at managing an economic crisis. The Obama response to the 2008 financial crisis was good and saved the financial system as we know it using stimulus, bailouts, and lowering interest rates. While most governments failed to lock down and react quickly enough to the COVID-19 virus, they did enact enough stimulus to stop massive and widespread poverty through unemployment, which resulted in a quick end to the Corona crash in 2020.

How To Avoid A Stock Market Crash

The total protection of your money from a market crash is impossible. However, you can minimize risks and protect most of your investments with a few precautions. Thus, keeping most of the assets in your 401K safe in a bear market is possible. However, you must be careful not to sacrifice your portfolio’s ability to grow to avoid risks.

Move to Cash in a Crash

Generally, stocks fall in value twice as quickly as they gain value.  The best price gains are longer-term uptrends over multiple years.  Crashes happen quickly and violently due to the panic and fear in the market.  However, a real crash can be devastating to your wealth, luckily they are fairly infrequent.

Worst Stock Market Crash Years

The three worst crashes of all time were the great depression of 1929, the worst year being 1931 with a 47% drop, followed by 1937 with a 39% drop.  The next worse was in 2008 with a 38% drop in one year.


The simple truth is that when there is a real stock market crash, most, if not all, stocks fall. So, diversification in safe stocks will not help you. Moving your portfolio to cash or government bonds is the best course of action. This means total protection from falling stocks.

However, there is one problem with moving to cash: the timing. If you move to cash too early and the market recovers quickly, you may miss out on stock market gains. Move too late, and you will have lost too much money; in this case, you should employ a dollar-cost averaging strategy.

The problem of timing your cash move is covered with our Market Outperforming Stock ETF Strategy.


Beat The Market, Avoid Crashes & Lower Your Risks

Nobody wants to see their hard-earned money disappear in a stock market crash.

Over the past century, the US stock market has had 6 major crashes that have caused investors to lose trillions of dollars.

Moses Index ETF Strategy

The MOSES Index ETF Investing Strategy will help you minimize the impact of major stock market crashes. MOSES will alert you before the next crash happens so you can protect your portfolio. You will also know when the bear market is over and the new rally begins so you can start investing again.

MOSES Helps You Secure & Grow Your Biggest Investments
★ 3 Index ETF Strategies ★
★ Outperforms the NASDAQ 100, S&P500 & Russell 3000 ★
★ Beats the DAX, CAC40 & EURO STOXX Indices ★
★ Buy & Sell Signals Generated ★
MOSES Helps You Sleep Better At Night Knowing You Are Prepared For Future Disasters

Find Out More


Frequently Asked Questions

What is the definition of a stock market crash?

A stock market crash is an abrupt and dramatic decline in the value of stocks traded on the stock market. Typically, a crash occurs when there is an imbalance between the level of supply and demand for stocks, resulting in a rapid price decline that can trigger a domino effect.

What percentage drop is considered a crash?

Data suggests the threshold for a major stock market crash is typically a drop of over 30%. The 1929, 1973, 1987, 2000, 2008, and 2020 crashes averaged a 57% drop over an average of 17 months.

What is the difference between a stock correction and a crash?

A stock correction refers to a temporary decline in the value of stocks between 5-20%, unlike a crash which is an abrupt and dramatic decline of 30%+ over an average of 17 months.

When did the stock market crash?

The major stock market crashes on record were in 1929, 1973, 1987, 2000, 2008, and 2020. The biggest crashes were in 1929 when the Dow lost -89%, and in 2000 when the Nasdaq 100 lost -83%.

How does the stock market crash?

A stock market crash is usually the result of several factors beyond investors’ control. It can be driven by macroeconomic events such as recessions, high inflation, rising interest rates, and lack of financial regulation.

What causes a stock market crash?

The evidence suggests the main cause of stock market crashes is a relaxed monetary policy leading to easy credit access. Combine cheap money with poor institutional risk management and lack of regulatory oversight, and you get asset bubbles ready to burst.

When was the last stock market crash?

The last major stock market crash was in 2020. The crash was triggered by the COVID-19 pandemic and the resulting economic uncertainty. However, in 2023, the market declined 27.5%, and if a recession hits, it might decline further to register a full crash in 2024.

Why did the stock market crash in 2008?

The 2008 stock market crash was caused by the housing bubble bursting and increasing consumer debt levels. The subprime mortgage crisis was caused by a lack of regulation, coupled with easy credit access, which led to a massive surge in home prices and an unsustainable level of consumer debt triggering the financial crisis.

Where does money flow during a crash?

During a stock market crash, investors tend to move their money from stocks to safer investments such as bonds, cash, and gold. As stock prices decline, investors see the risk of holding stocks as too high and look for safer alternatives. This can cause a further decline in stock prices, creating a vicious cycle.

Does money disappear during a stock market crash?

During a stock market crash, the value of stocks decreases, and yes, money evaporates. Similarly, during high inflation, the value of money also declines, meaning the destruction of wealth.

How do people first react to a stock market crash?

People often initially react to a stock market crash with shock and disbelief. Many investors may panic, rushing to sell their stocks to avoid further losses or hold onto them out of fear of missing an eventual rebound.

Did the 1929 stock market crash cause the great depression?

The 1929 stock market crash is widely regarded as having contributed to the Great Depression of the 1930s. This crash was caused by a combination of overstretched stock prices, margin trading, and a lack of regulation in the banking system. The result was an economic catastrophe that lasted 23 years.

How many times has the stock market crashed?

There have been six major stock market crashes in the last 100 years, 1929, 1973, 1987, 2000, 2008, and 2020.

Who were the presidents when the stock markets crashed?

The first major stock market crash happened in 1929 during the presidency of Herbert Hoover (R), from 1929 to 1933. The second occurred in 1973 when Richard Nixon (R) was president (1969-1974). The third crash happened in 1987 under Ronald Reagan (R) (1981-1989). The fourth was in 2000 under Bill Clinton (D) (1993-2001). The fifth crash was in 2008 under George W. Bush (R)(2001-2009). The most recent was in 2020 under Donald Trump (R) (2017-2021).

How long do stock market crashes last?

Our research shows the average stock market crash lasts 17 months, and the average time for a full stock market recovery to pre-crash prices is 9.8 years. Excluding the 1929 crash, the average time to recover is 6.8 years.

A Complete Graphical History of Stock Market Events & Crashes

A Complete History of Stock Market Events
A complete history of stock market events and their impact on the stock market from 1916 to today.

The Next Stock Market Crash Prediction. Predicting the 2023 Market Crash.

Source link

#Stock #Market #Crashes #History #Effect #Fixes

Master Technical Analysis: A 14-Video Ultimate Guide


Technical analysis is a key methodology used to predict future asset prices by examining supply and demand. It uses historical market data, primarily price and volume, to estimate future asset price direction.

Our ultimate guide to technical analysis will fast-track your knowledge with our 14 videos and detailed examples covering charts, trends, indicators, patterns, and tools.

1. Key Takeaways


Technical Analysis: Fast-Track Guide with Videos & Examples

  • Technical analysis and fundamental analysis are the two cornerstones of asset price prediction.
  • Technical analysis forecasts price movement probabilities based on historical market data and trends.
  • Investors use chart patterns and indicators to identify trading signals and assess market conditions.
  • Stock price and volume are combined into indicators to assess supply and demand, which helps forecast market direction.
  • This analysis considers trading psychology and market sentiment to complement its predictive models.

Technical analysis uses the premise that prices move in trends and that these trends can be discerned through the study of market action. This is done without considering the company’s underlying financial conditions or the overall economy.

2. Technical Analysis Simplified


How to Swing Trade a Cup and Handle Pattern

How to Swing Trade a Cup and Handle Pattern

In simple terms, technical analysis assumes that if a stock price increases and more people buy it at higher prices, the asset price will continue increasing. In contrast, if prices are decreasing and more people are selling than buying, we expect the downtrend to continue.

If the price increases and the number of buyers decreases, we can expect the trend to slow or change direction.

Technical analysis is the study of supply and demand using price direction and the volume of trades.


When plotted as a chart, these price movements are known as price trends, and these trends form patterns over time. Trends, patterns, and indicators are the cornerstone of technical analysis.

3. What is Technical Analysis?


Technical Analysis: How to draw trendlines on charts. Uptrends, downtrends and consolidation lines.

Technical analysis is a methodology that transforms market price and volume data into charts, patterns, and indicators to interpret supply and demand and, therefore, market sentiment.

It uses charts to interpret market psychology by studying price movements and trading volumes. To many technical analysts, the underlying financial details of the individual securities are less relevant.

Technical analysis considers market sentiment through supply and demand, which are reflected in the price movements on charts.

Understanding Price Movements

Price movements are the core focus of technical analysis, reflecting all known market information. Analysts monitor price trends and patterns to predict future activity based solely on the security’s historical and current prices.

They do not typically concern themselves with a security’s intrinsic value. Instead, they focus on the patterns and trends that suggest where its price could move next.

The Importance of Volume

Volume, the total number of shares or contracts traded in a given period, is a primary indicator of market strength. High volume suggests a strong interest in a security, indicative of the pressure from supply and demand that will likely propel price movement. Low volume may indicate uncertainty and less reliable price movements, making trends less predictable.

▶️ Video: Understanding Volume

Try TrendSpider, The Trader’s Tool of Choice

Support and Resistance Concepts

Support and resistance levels are critical tools in Technical Analysis. Support is the price level at which demand is considered strong enough to prevent the price from declining further. Resistance, conversely, is the ceiling where selling pressure overcomes buying pressure, and a price increase is halted. These concepts are pivotal in determining the price points at which markets tend to reverse their direction.

Technical Analysis: How to draw trendlines on charts. Support and Resistance lines.
Support and resistance trendlines. Support lines connect the lowest lows of price, providing a baseline. Resistance lines connect the price peaks, forming resistance.

Understanding these basic principles allows one to interpret market dynamics and make more informed trading decisions.

4. Types of Charts


Open-High-Low-Close (OHLC) Charts Explained

Open-High-Low-Close (OHLC) Charts Explained

In technical analysis, charts are crucial in visualizing price movements and market trends over various time frames. Traders and analysts utilize nine chart types to identify patterns and make informed decisions.

Stock chart types include OHLC and Candlestick charts displaying open, high, low, and close prices. Raindrop charts incorporate volume data. Heikin Ashi charts reduce price volatility. Kagi, Line Break, and Point & Figure charts focus on trends without a timeline.

▶️ Video: Stock Chart Types

Video Research Performed with TrendSpider

Candlestick Chart Analysis

Candlestick charts are a popular tool for traders due to their extensive information display. Each candlestick represents four key prices: the open, close, high, and low within a specific time frame.

▶️ Video: Candlestick Charts

For instance, a single candlestick may symbolize a day of trading or an hour, depending on the chart’s time scale. Reliable patterns, such as doji or hammer, can signal potential market reversals or continuations.

Reading Chart Patterns

Analysts discern chart patterns to forecast future price movements. These patterns, found across candlestick, bar, and line charts, can be classified as either continuation or reversal patterns. They rely heavily on the visual analysis of the charting data; familiar patterns include head and shoulders, wedges, and triangles’.

▶️ Video: 12 Chart Patterns

Mastery of chart patterns can enhance an investor’s ability to anticipate market behavior.

5. Technical Indicators and Oscillators


How to use the RSI indicators to trade and make buy and sell decisions.

How to use the RSI indicators to trade and make buy and sell decisions.

Technical indicators and oscillators are pivotal tools in technical analysis, providing traders with insights into market trends, momentum, and volume. They are the foundation for making informed trading decisions based on past market performance.

Moving Averages

Moving averages are fundamental indicators that smooth out price data to form a trend-following line. The most common types are the Simple Moving Average (SMA) and the Exponential Moving Average (EMA).

▶️ Video: Moving Averages Indicator

The SMA calculates the average price over a specified number of periods, while the EMA gives more weight to recent prices and reacts more quickly to price changes.

Momentum Indicators

Momentum indicators measure the speed of price changes and help traders identify overbought or oversold conditions.

Momentum indicators are chart overlays used in technical analysis to help traders identify the strength and direction of a stock’s price movement. They work on the idea that a trend will persist until there’s a shift. By examining how fast a stock’s price changes, these indicators can show if a stock is overbought or oversold and predict if a trend will continue or reverse.

There are various momentum indicators, each with pros and cons. Three common ones include RSI, MACD, and Stochastics.

Relative Strength Index (RSI)

Relative Strength Index (RSI) measures the strength of a stock’s price movement over a set period. Ranges from 0 to 100. Readings above 70 signal overbought conditions, and below 30 signal oversold.

▶️ Video: RSI Indicator

Moving Average Convergence Divergence (MACD)

Moving Average Convergence Divergence (MACD) compares two moving averages of a stock’s price. A positive reading indicates a short-term average above the long-term, a bullish sign. When the MACD histogram is below the center line, it is bearish.

▶️ Video: MACD Indicator

Stochastic Oscillator

Stochastic Oscillator: Gauges a stock’s price compared to its range over a specific period. Scale from 0 to 100. Above 80 means overbought, and below 20 means oversold.

▶️ Video: Stochastics Indicator

Volume and Volatility Indicators

Volume indicators provide insights into the strength of a price move by quantifying the amount of trading activity. High volume often indicates strong interest in a stock. Volatility indicators, on the other hand, reflect the rate and magnitude of price changes.

These indicators are indispensable for assessing market sentiment and potential price breakouts or reversals.

6. Trend Analysis and Forecasting


Technical Analysis: How to draw trendlines on charts. Uptrends, downtrends and consolidation lines.

Technical Analysis: How to draw trendlines on charts. Uptrends, downtrends, and consolidation lines.

Trend analysis plays a pivotal role in the technical analysis ecosystem. It gives traders and analysts insights to predict market trends and shape forecasting strategies. This analysis leans heavily on historical data to identify the likelihood of future price movements.

Identifying Trends and Trendlines

Traders pinpoint trends, such as an uptrend or downtrend, by analyzing price movements over time.

Higher highs and higher lows characterize uptrends, whereas downtrends exhibit lower highs and lower lows.

Trendlines are drawn, connecting these highs and lows to visualize the trend’s trajectory and strength. The reliability of these trendlines increases with the number of connecting points, providing a clearer forecast of potential market behavior.

Continuation and Reversal Patterns

Recognizing continuation and reversal patterns is essential for forecasting market directions.

Continuation patterns, like flags or triangles, suggest that the market will persist in its current direction. On the other hand, reversal patterns, such as head and shoulders or double tops, signal that the market trend may change course.

▶️ Video: Reversal Patterns

Dow Theory Fundamentals

Dow Theory lays the groundwork for analyzing market trends. It asserts that market prices reflect all known information.

The theory is categorized into three movements: primary, secondary, and minor. Primary trends last a year or more and represent the broad market direction. Secondary trends are corrective movements within the primary trend, lasting three weeks to three months. Minor trends are short-term fluctuations.

▶️ Video: Dow Theory

Dow Theory posits that a trend continues until a clear reversal occurs, assisting analysts in distinguishing between normal market corrections and actual reversals of trends.

7. Technical vs. Fundamental Analysis


Fundamental vs. Technical Analysis

Fundamental vs. Technical Analysis

Investors have two primary methods to evaluate potential investments: technical analysis and fundamental analysis. Both have distinct strategies and focus on different market aspects to predict future stock performances.

While technical analysis is seen as being at odds with fundamental analysis, which focuses on a company’s financial health, most investors integrate both to inform their investment strategies.

Technical analysis studies price data and volume to forecast future market behavior.

Analysts use charts and various tools to identify patterns and trends that suggest potential market movements. This methodology assumes that the stock price already reflects all known information. Therefore, it focuses on what the price is doing rather than what the company is doing.

Fundamental analysis, in contrast, examines the economy, earnings, management, and sales to determine a company’s intrinsic value.

It scrutinizes financial statements, industry conditions, competitor comparisons, and the economic landscape. Fundamental analysts believe that the stock market may not fully reflect a company’s true value, potentially leading to opportunities to buy undervalued stocks or sell overvalued ones.

Integrating Both Approaches

While some investors may favor one method over the other, integrating both approaches can offer a more rounded perspective on an investment.

For example, an investor could use fundamental analysis to select a company with strong earnings and solid management. Then, they could apply technical analysis to determine the optimal time to execute the trade based on price data trends.

This combined strategy aims to leverage the holistic view of fundamental analysis with the timing precision of technical analysis.

8. Trading Psychology and Market Sentiment

In the domain of technical analysis, understanding the collective mindset of market participants—trading psychology and market sentiment—is crucial. They influence trading decisions and are pivotal in the success of traders and investors.

Behavioral Finance Insights

Behavioral finance offers valuable insights into how psychological factors and biases affect the financial decisions of traders and investors. It underlines that market participants are not always rational, and cognitive biases and emotions can influence their decisions.

Sentiment Indicators: Fear & Greed

Sentiment indicators are tools used to gauge the mood of the market. The VIX Volatility, the NYSE Advance-Decline Ratio, and the AAII Sentiment Indicator are common sentiment indicators. All of these are included in our live interactive Fear and Greed Index.

Contrarian approaches involve making trading decisions that go against prevailing market sentiment. For example, if the majority of investors are bullish, a contrarian might take this as a signal that it’s time to sell.

▶️ Video: Bullish Patterns & Sentiment

Bullish Sentiment Patterns: When traders expect upward price movement.

▶️ Video: Bearish Patterns & Sentiment

Bearish Sentiment: When traders anticipate a decline in prices.

Traders often use these indicators to inform their decisions. They look for signs of extreme sentiment, which may suggest potential market reversals.

9. Technical Analysis Tools & Resources


Best Stock Trading Technical Analysis Software

Best Stock Trading Technical Analysis Software

Technical analysis is a methodology for forecasting the direction of prices through the study of complex market data. Fortunately, there are tools that radically simplify the task of analyzing stocks and indexes.

The best technical analysis tools allow you to create trading systems, backtest strategies, and automate trading using artificial intelligence and bots.

Trading Systems and Strategies

Trading systems are structured frameworks that use technical analysis to generate trading signals. These signals help traders identify potential trading opportunities by analyzing market trends and patterns.

Strategies within these systems are based on a set of rules that dictate when to enter or exit trades. They are often tailored to the risk management preferences of the individual or institution.

Backtesting & Strategy Development

Backtesting is an essential process where traders test their trading systems and strategies against historical data to assess their efficacy. By applying technical analysis to historical trading data, traders can identify how signals would have performed in the past. This helps understand potential risk and return profiles for various assets, including individual stocks and securities.

▶️ Video: Backtesting a Chart Indicator

Testing Performed with TrendSpider, Our Recommended Trading Tool

Automated Trading Bots

Automated trading bots are programs that execute trades on behalf of the trader using predefined trading systems and algorithms.

These bots analyze real-time market data, apply technical analysis to generate trading signals, and execute trades. They often include sophisticated risk management protocols to safeguard against market volatility.

10 Best Automated Trading Platforms Tested of 2024

AI in Stock Trading

Artificial intelligence (AI) has significantly impacted the stock trading industry. With advanced algorithms, AI can analyze large data sets and find patterns or trends humans may miss. This results in more accurate predictions and faster decision-making.

Some companies like TrendSpider even developed AI-powered trading bots that can autonomously trade stocks based on market data and historical performance.

10 Best AI Stock Trading Bot Software Tested 2024

Applying Analysis to Different Markets

Technical analysis is not confined to a specific market and can be applied to a range of asset classes.

Whether trading futures, commodities, currencies, or stocks, charting and pattern recognition principles are crucial in identifying potential trades and investment opportunities across these diverse markets.

10. FAQ

What is the best software for technical analysis of stocks, Forex, and crypto?

After completing thorough testing, we recommend TrendSpider because it can automate the development of backtested trading strategies. It can also auto-trade using bots and connect directly to your broker.

What is technical analysis?

Technical analysis is used to assess investments and spot trading opportunities by analyzing statistical trends in price movements and volume.

How do I start learning stock trading?

At Liberated Stock Trader, we have a range of professional training courses to help you kick-start your knowledge in stock trading. I highly recommend our Liberated Stock Trader Pro course.

How does technical analysis differ from fundamental analysis?

Technical analysis focuses on market patterns and price movements to predict future movements, whereas fundamental analysis looks at financial statements to determine a security’s intrinsic value.

What are the four principles of technical analysis?

Technical analysis operates on four principles: the market discounts everything, prices move in trends, history tends to repeat itself, and patterns are identifiable and can be exploited for trading opportunities.

What are common indicators used in technical analysis?

Common indicators in technical analysis include moving averages, Bollinger Bands, relative strength index (RSI), and candlestick charts—these aid traders in identifying support and resistance levels, trends, and potential entry and exit points.

How can technical analysis be applied to trading strategies?

Technical analysis can be applied to trading strategies by providing signals through patterns and indicators. These signals help in the timing of trades. Traders develop systems around these to capitalize on expected price movements.

Can technical analysis be used for all types of securities?

Yes, technical analysis can be applied to any security with historical trading data. This includes stocks, bonds, commodities, and currencies, among others.

What does volume mean in technical analysis?

Volume refers to the number of shares or contracts traded during a given period. It is often used as an indicator of the strength or weakness of a market move, with higher volumes associated with more significant movements.

Is technical analysis better for short-term or long-term trading?

Technical analysis can be used for both short-term and long-term trading; it all depends on the chart’s time frame. Short-term traders may look at minutes or hours, while long-term traders may look at days, weeks, or even years.

What is a trend in technical analysis?

A trend refers to the general direction in which a security or market moves. Trends can be upward, downward, or sideways and are a core concept in technical analysis.

11. Liberated Stock Trader Pro Training

Learn stock market investing with the complete online stock trading course by Barry D. Moore, a certified financial analyst from the International Federation of Technical Analysts (IFTA).

I am Barry D. Moore, a certified financial analyst and head of research at Liberated Stock Trader. Please let me introduce you to my Liberated Stock Trader Pro stock investing course.


Barry D. Moore CFTe

With a wealth of experience spanning 23 years in stock investing and trading, Barry D. Moore (CFTe) is an author and Certified Financial Technician (Market Analyst) recognized by the International Federation of Technical Analysts (IFTA). Notably, he has also held executive positions in leading Silicon Valley corporations IBM Corp. and Hewlett Packard Inc.


Source link

#Master #Technical #Analysis #14Video #Ultimate #Guide

Fundamental Analysis Of Praveg – Financials, Future Plans & More

Fundamental Analysis Of Praveg The travel market in India is projected to reach US$125 billion by FY27, and the event and exhibition market is expected to reach USD 7,550.05 million by 2027. A small-cap company in this sector has become a standout player, grabbing the market’s attention. Let’s delve into the story of Praveg Limited, a company that gave more than 37,000% return in just 5 years.

Fundamental Analysis Of Praveg

Company Overview

Established in 2005, Praveg Limited has emerged as the leading exhibition management company with over 20 years of successful operations. Having orchestrated more than 3000 events and exhibitions in India and abroad, Praveg has become a service powerhouse with a diversified portfolio encompassing exhibition management, event management, tourism and hospitality, and publication.

telegram channel

With a rich experience spanning two decades, a robust client base exceeding 100, and an impressive track record of managing over 1,000 events and 2,000 exhibitions, Praveg has solidified its position in the industry. Noteworthy achievements include the management of 3 tent cities with 450+ rooms spread across 3 lakh sq m, selling over 83,000 rooms, and serving 4,20,000+ meals.

Beyond its roots in advertising and event and exhibition management, Praveg has evolved into a pioneer in tourism and hospitality, offering comprehensive and innovative solutions. The company’s global footprint extends from the USA to China, South Korea, Africa, Europe, and the Middle East, making Praveg a key player in executing large-scale projects across the globe.

Its client base includes GSPC, ICAI, Indian Oil, SAIL, NTPC, Gujrat Tourism, etc. from the government sector and Suzlon, Reliance, Adani, TATA Power, Wipro, Hitachi, etc. from the private sector.

Segment Analysis

Exhibition & Event Management

The exhibition and events industry is responsible for the organization and execution of gatherings, trade exhibitions, conferences, and expos. It serves as a forum for presenting products, services, and ideas while also encouraging networking, collaboration, and industry growth. Event management in this area entails coordinating logistics and guaranteeing smooth implementation, which contributes considerably to economic growth. 

Tourism & Hospitality

Tourism involves the movement of people for leisure, business, or other purposes, exploring new destinations and cultures. Hospitality, on the other hand, refers to the services and lodgings provided to guests while they travel, assuring their comfort and contentment. Together, these industries make a considerable contribution to the global economy by providing jobs, promoting cultural interchange, and improving the overall well-being of both passengers and local populations.

Segment Analysis Praveg Limited

Industry Overview

The Indian economy showed rapid growth in 2022, the second consecutive year of strong recovery following a deep economic contraction in 2020 due to the COVID-19 pandemic. The Indian economy has remained resilient despite the ongoing global headwinds caused by external factors like post-pandemic spillovers, supply chain disruptions due to the ongoing Russia-Ukraine conflict, and potential recessionary pressures facing developed economies.

Tourism & Hospitality

Tourism in India highlights the country’s amazing history, culture, and diverse experiences, bringing not just cultural richness but also important economic advantages. The growth of India’s middle class and the rise in disposable income have played a role in supporting both local travel within the country and trips abroad.

The travel market in India is projected to reach US$ 125 billion by FY27 from an estimated US$ 75 billion in FY20. The Indian airline travel market was estimated at ~US$ 20 billion and is projected to double in size by FY27 due to improving airport infrastructure and growing access to passports. The Indian hotel market, including domestic, inbound, and outbound, was estimated at ~US$ 32 billion in FY20 and is expected to reach ~US$ 52 billion by FY27, driven by the surging demand from travelers and sustained efforts of travel agents to boost the market.

Events & Exhibitions

Exhibitions and events play a crucial role in boosting the economy. As India continues to be one of the fastest-growing economies, government initiatives aimed at supporting businesses across various sectors are anticipated to enhance the demand for events and exhibitions in the country.

The Indian event and exhibition market was valued at USD 3,674.95 million in 2022, and it is expected to reach USD 7,550.05 million by 2027, registering a CAGR of 12.43% during the forecast period of 2022-2027

Fundamental Analysis Of Praveg – Financials

Revenue & Net Profit

The company’s financial statement indicates that revenue has increased by 86.7 percent from ₹45.25 crores to ₹84 crores from FY22 to FY23, respectively. On a 4-year CAGR basis, the company grew by 8.78 percent. This increase was mainly due to a substantial rebound in the tourism industry.

The net profits of the company have increased by 132 percent, from ₹12 crore in FY22 to ₹28 crore in FY23. On a 4-year CAGR basis, the company has grown by 74.79 percent.

This increase was on account of an increase in operating profit and a marginal reduction in administrative costs. The decrease in revenues in FY20 and FY21 was mainly due to the impact of COVID-19.

The table below exhibits the revenue and profits of Praveg Limited over the last 5 years.

Profit Margins

Praveg reported a 10 percent rise in operating profit margin (OPM) and a ~7 percent rise in net profit margin (NPM) from FY22 to FY23. The rise was consistent with the net profits. The margins have been trending upward and improved their 5-year average to 30.49 percent and 19.06 percent, respectively.

The margins improved significantly on account of a surge in demand and a decrease in operating costs for rent and travel expenses as compared to the previous year.

The table below exhibits the profit margins of Praveg over the last 5 years.

Return Ratios

As for its return ratio, Praveg’s business generates a healthy return on capital employed and equity. Its RoCE and RoE stood at a whopping 34.55% and 25.28%, respectively, in FY23.

The RoCE and RoE ratios have decreased even after the increase in profitability due to the increase in equity base on account of money received on the issue of equity shares on a preferential basis. On a longer perspective, the ratios have remained similar.  The ROE in FY19 was negative due to losses the company made, which turned the 5-year average negative.

The table below shows the ROE and RoCE of Praveg for the last 5 years:

Leverage Ratios

Looking at the company’s leverage status, we can see that it maintained very low debt and is almost debt-free now. Over the last 5 years, the highest recorded debt-to-equity ratio was 0.12 in FY22.

This indicates that the company is less financially burdened because it relies less on borrowed capital to fund its operations and expansion. This also means that the company can retain more of its revenue because it has a small commitment to repay debt and interest.

In terms of interest, the company’s interest coverage ratio increased in FY23, which was reported at 65.62. This means the company has generated enough gross profits to cover its interest expenses 65 times over, which is mainly due to an improved marginal collection mechanism and efficient use of assets.

The table below shows the D/E and interest coverage ratio of Praveg for the last 5 years:

Key Metrics

Fundamental Analysis Of Praveg – Future Plans

  • By 2025, Praveg has the vision to create over 1,000 rooms across 25+ resort destinations, offering exceptional hospitality experiences around the globe.
  • Our sights are set on a wider horizon as we prepare to enrich our hospitality portfolio by creating our world-class resorts in Udaipur, Ranthambore, Jawai Dam, and Velavdar in the foreseeable future.
  • Capitalize the untapped potential across our established brand equity and diverse product portfolio
  • Praveg has eight under-construction and three under-planning hospitality projects.
  • It will carry forward its legacy of success by creating a niche in the news genre and commencing its journey as a Gujarati news channel.
  • Praveg has projects starting soon in Dholavira, Velavdar, Ahmedabad, Udaipur, Jawai, Ranthambore, and other locations 
  • The company was awarded a work order for the Development of a Tent City along Bramha Kund at Ayodhya, Uttar Pradesh
  • Plan to establish a resort and theme destination in Adalaj, Gujarat, collaborating with the Tourism Corporation of Gujarat Limited.

Conclusion

In the article “Fundamental Analysis of Praveg,” we have looked at their business, the industry in which it operates, its five-year financials, and its plans. The forthcoming period is set to witness robust growth primarily driven by domestic demand, and this momentum is projected to remain strong throughout FY 2023–24.

While international travel is in the process of recovering, there remains ample room for further demand escalation, creating a great deal of opportunities for future growth for the company. In addition to all this, further analysis is recommended before investing to understand the risk and return characteristics of this company.

What do you think about Praveg as an investment opportunity? Do let us know in the comments section below.

Written by Ashish Agarwal

By utilising the stock screenerstock heatmapportfolio backtesting, and stock compare tool on the Trade Brains portal, investors gain access to comprehensive tools that enable them to identify the best stocks, also get updated with stock market news, and make well-informed investments.


Start Your Stock Market Journey Today!

Want to learn Stock Market trading and Investing? Make sure to check out exclusive Stock Market courses by FinGrad, the learning initiative by Trade Brains. You can enroll in FREE courses and webinars available on FinGrad today and get ahead in your trading career. Join now!!

Source link

#Fundamental #Analysis #Praveg #Financials #Future #Plans