
Welcome to the the tenth publication of the Market’s Compass Weekly Crypto Sweet Sixteen Study. The Study tracks the technical condition of sixteen of the larger market cap cryptocurrencies. I have compiled the historic quantitative objective technical ranking data and secondary technical indicators including the Sweet Sixteen Total Technical Rankings and Weekly Average Technical Ranking back to October of 2021. Every week the Studies will highlight the technical changes of the 16 cryptocurrencies that I track as well as individual highlights on noteworthy moves in certain cryptocurrencies and Indexes.
The Excel spreadsheet below indicates the weekly change in the objective Technical Ranking (“TR”) of each individual Cryptocurrency. The technical ranking or scoring system is an entirely quantitative approach that utilizes multiple technical considerations that include but are not limited to trend, momentum, measurements of accumulation/distribution and relative strength. If an individual Cryptocurrency’s technical condition improves the Technical Ranking (“TR”) rises, and conversely, if the technical condition continues to deteriorate, the TR falls. The TR of each individual Cryptocurrency can range from 0 to 50. The spreadsheet below also acts as a “heat map” in that, cryptocurrencies with a TR in the range of 1 to 15 are highlighted in red, 15.5 to 34.5 are noted in blue and TRs in the range of 35 to 50 are in green. The primary take-away from this spread sheet should be the trend of the individual TRs, either the continued improvement or deterioration, as well as a change in direction. A sustained trend change needs to unfold in the individual TRs for it to be actionable. Secondarily a very low ranking can signal an oversold condition and conversely a continued very high number can be viewed as an overbought condition but, as we know, over sold conditions can continue at apace and overbought securities that have exhibited extraordinary momentum can easily become more overbought. Thirdly, the weekly TRs are a valuable relative strength/weakness indicator vs. each other, in addition when the Total Sweet Sixteen Technical Ranking (“SSTTR”), that has a range of 0 to 800, is near the bottom of its range and an individual cryptocurrency has a TR that remains elevated it speaks to relative strength. Conversely if the SSTTR is near the top of its recent range and an individual cryptocurrency has a TR that remains mired at low levels it speaks to relative weakness. Lastly I view the objective Technical Rankings as a starting point in my analysis and it is not the entire “end game”.
This Week’s and 10 Week Trailing Technical Rankings of the 16 Individual Cryptocurrencies*
*Rankings are calculated up to the week ending Friday June 2nd
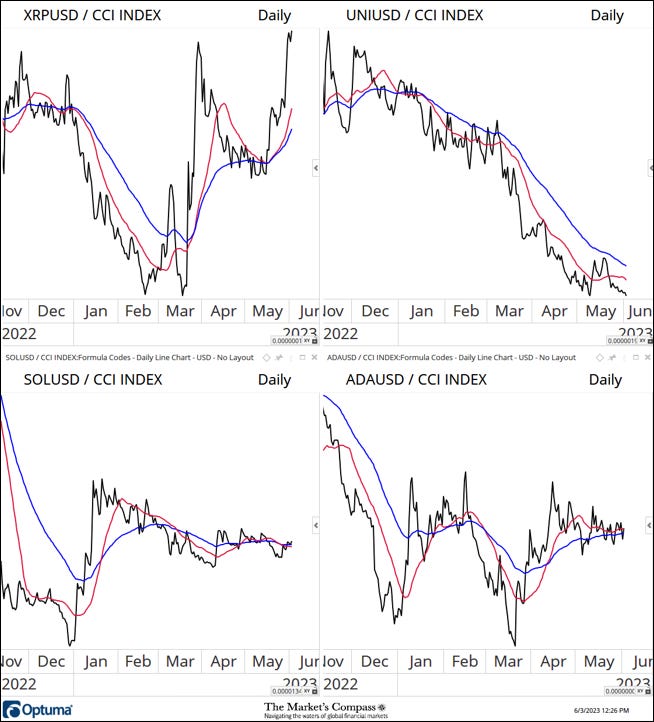
The Total Sweet Sixteen Technical Ranking or TSSTR has risen four weeks in a row. The TSSTR rose 19.65% to 374 from 300.5. The rise in Solana’s (SOL) and Litecoin’s (LTC) individual Technical Rankings accounted for nearly 40% of the rise in the TSSTR. As will be seen below SOL and LTC TRs rose 15 and 14 respectively. Charts are as of last Friday and thoughts on the technical condition of both are posted below the charts (the WoW changes in individual TRs of the balance of the Sweet Sixteen are posted below the charts that follow).
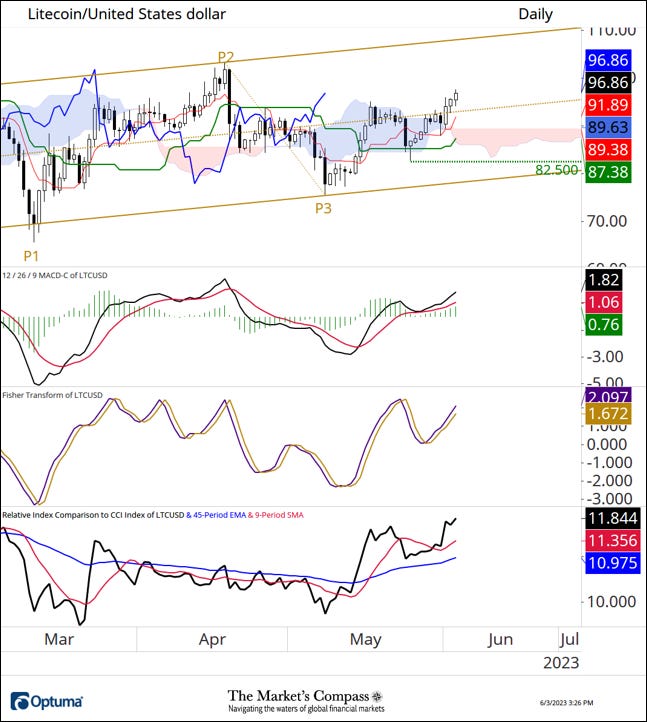
Over the past seven days, LTC has re-taken the ground above the Cloud model. It has also advanced above the Median Line (gold dashed line) of the Schiff Pitchfork (gold P1 through P3) and also the May 17th swing high after holding, on a closing basis, above the Kijun Plot (solid green line) and the the bottom of the Cloud model. MACD kissed its signal in mid-May and is tracking higher again confirming Fridays closing higher high in price. The Relative Comparison Index has marked a three month new high vs. the CCCi30 Index (bottom panel). These technical features suggest that the rally has further to run. I have raised support to the May 25th swing low at 82.50.
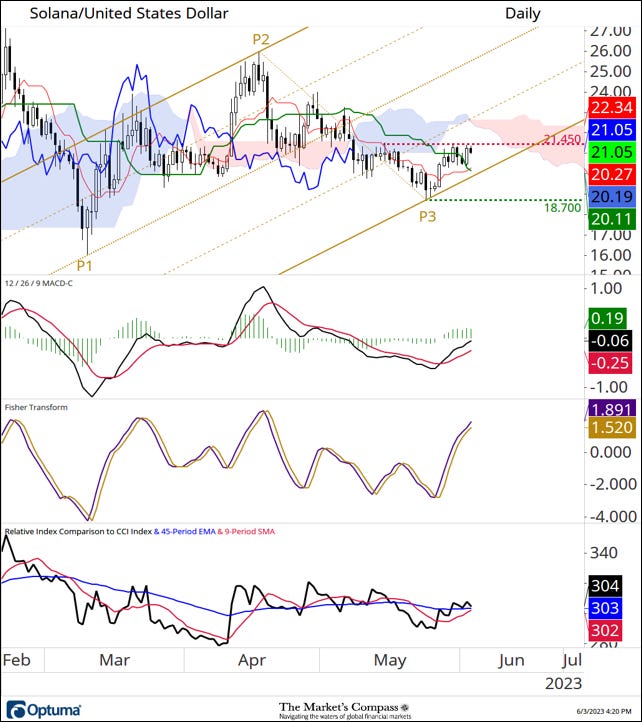
Solana has been consolidating the gains since the May 24th price swing low at the 18.70 (gold P3) (this marks key support). Thus far prices have been capped at price resistance at 21.45. A continuation of the short term rally through that level would place the next upside price target at the Cloud model and the 50% Internal Line (dashed gold line) of the Standard Pitchfork (gold P1 through P3). MACD has been tracking higher since the P3 low and is about to enter positive territory.

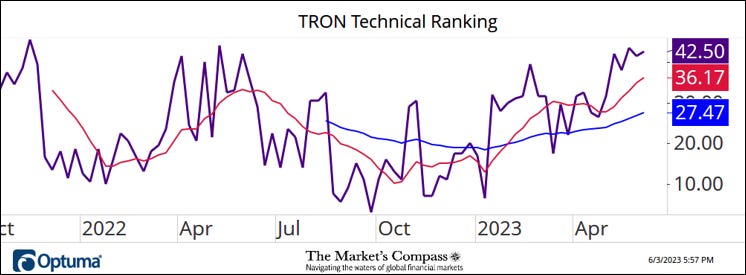
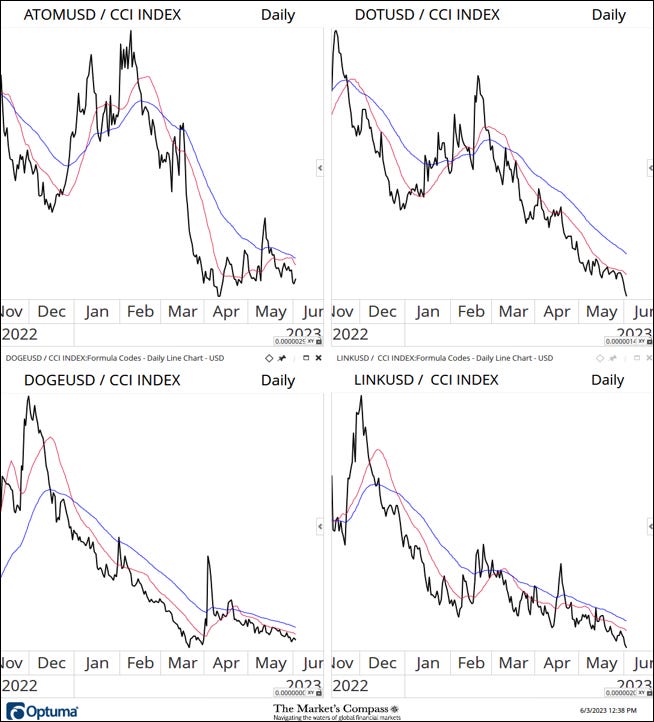
On a Wow basis, twelve Cryptocurrencies registered improvement in their objective TRs and four marked contractions. The average TR gain was +4.59. Three Cryptocurrencies ended the week in the “green zone” (TRs of between 35 and 50), seven were in the “blue zone” (TRs between 15.5 and 34.5) and six ended the week in the “red zone” (TRs between 1 and 15). The previous week there was only one in the “green zone”, eight were in the “blue zone” and seven were in the “red zone”. All TRs ended the week between up +15 and down -5. For the fourth week in a row, Tron (TRX) was in the green zone and at the end of last week it sported the best Technical Ranking at 42.5 (the TRX Weekly line chart of the TR is below with the 45 Week EMA (in blue) and the 9-week SMA (in red).
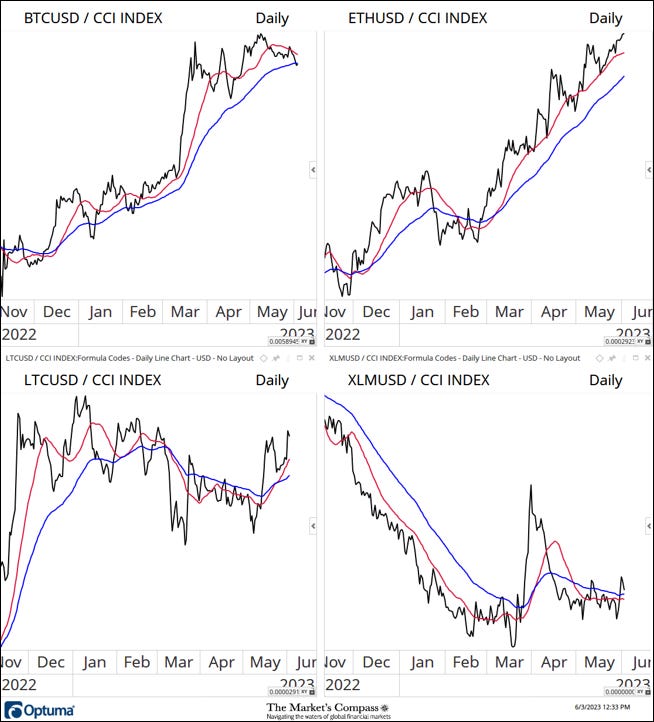
Measurements of Relative Strength and Weakness in the Sweet Sixteen vs. The CCi30 Index*.
*The CCi30 Index is a registered trademark and was created and is maintained by an independent team of mathematicians, quants and fund managers lead by Igor Rivin. It is is a rules-based index designed to objectively measure the overall growth, daily and long-term movement of the blockchain sector. It does so by indexing the 30 largest cryptocurrencies by market capitalization, excluding stable coins (more details can be found at CCi30.com).
“What’s in Your Wallet?”
I hope its been Ethereum (ETH), Ripple (XRP) or Tron (TRX) and not Polkadot (DOT or Avalanche (AVAX).

Seven Day Absolute % Price Change*
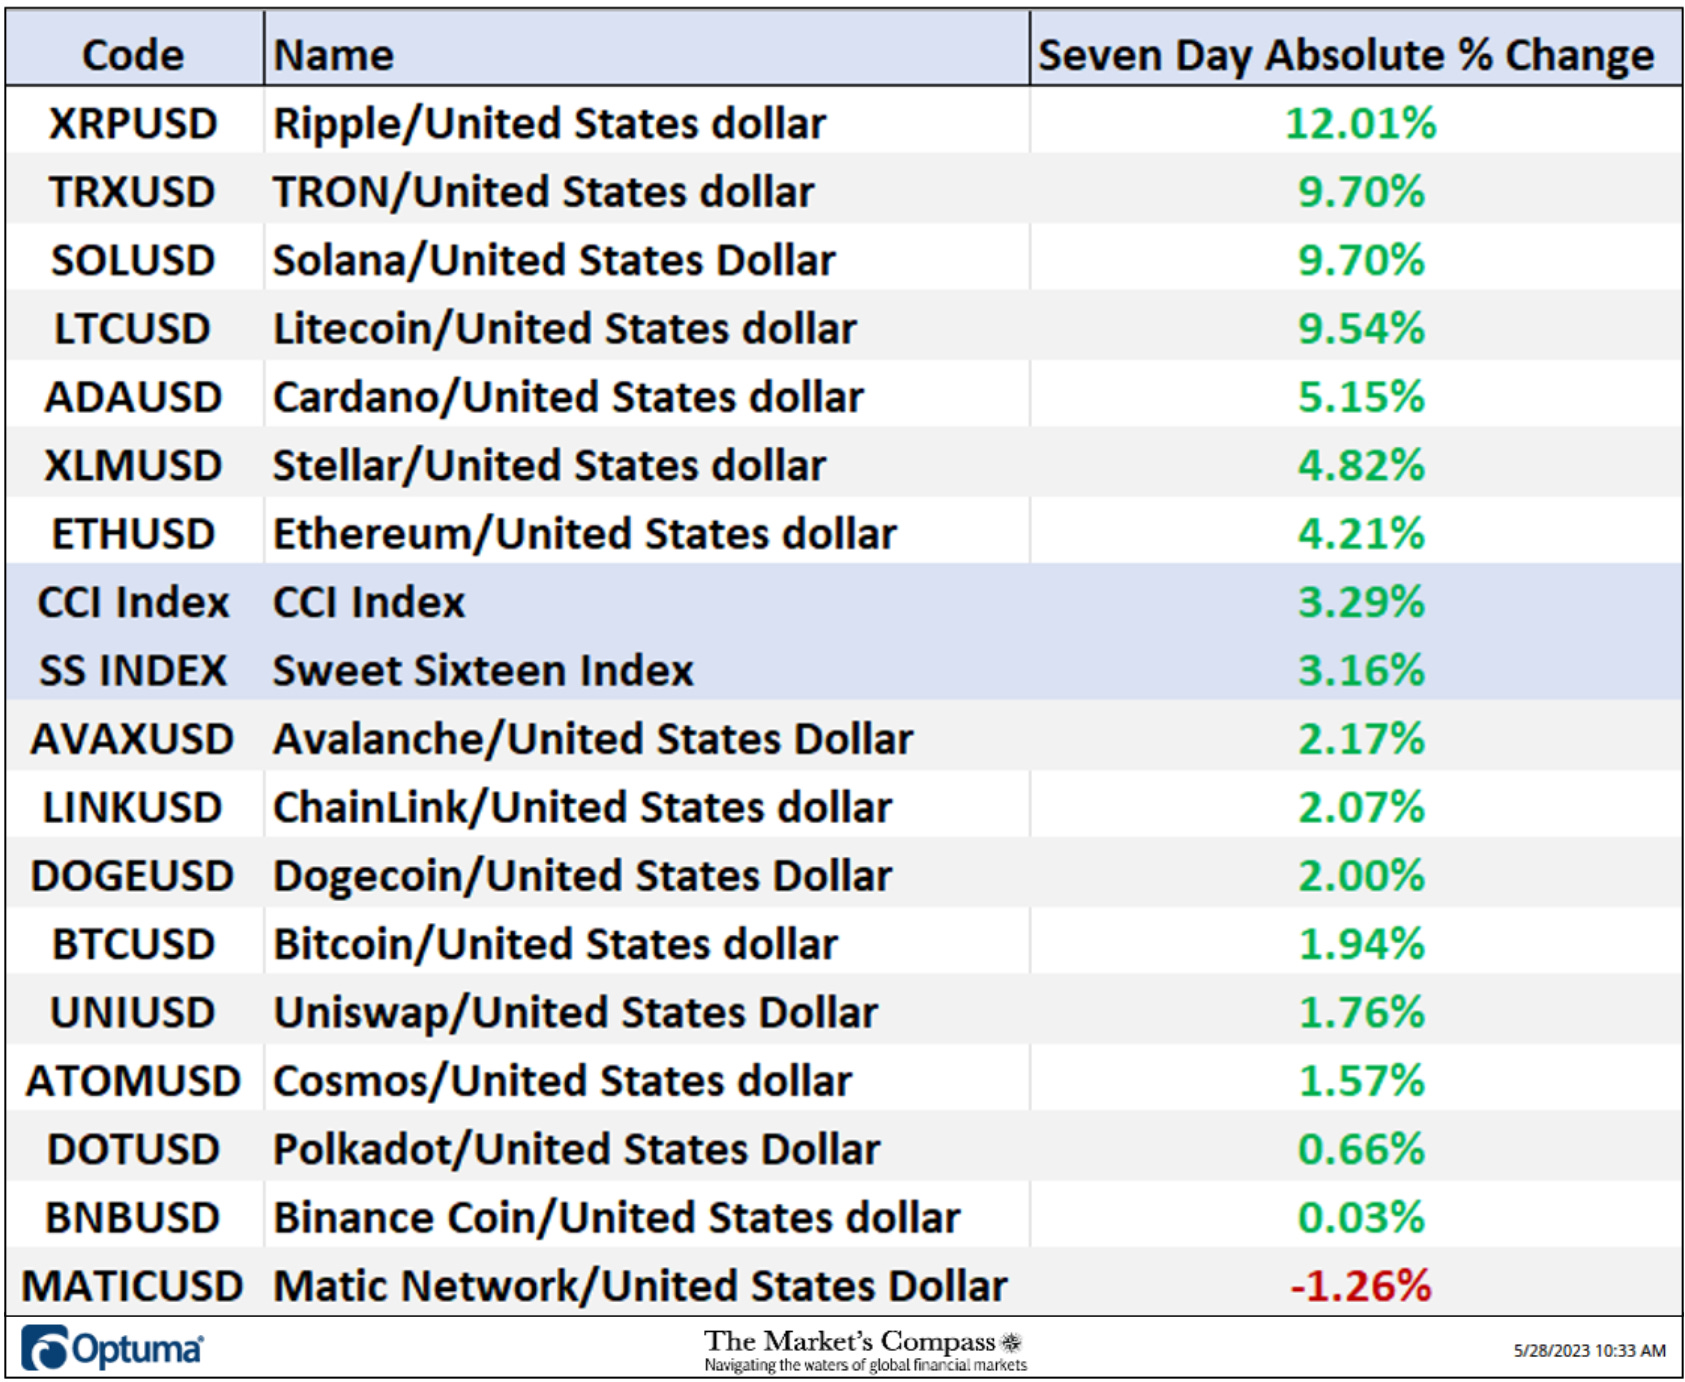
*Friday May 26th to Friday June 2nd
The Technical Condition Factor changes since the week ending May 19th
There are eight Technical Condition Factors (“TCFs”) that determine individual TR scores (0-50). Each of these 8, ask objective technical questions (see the spreadsheet posted above). If a technical question is positive an additional point is added to the individual TR. Conversely if the technical question is negative, it receives a “0”. A few TCFs carry more weight than the others such as the Weekly Trend Factor and the Weekly Momentum Factor in compiling each individual TR of each of the 16 Cryptocurrencies. Because of that, the excel sheet above calculates each factor’s weekly reading as a percent of the possible total. For example, there are 7 considerations (or questions) in the Daily Momentum Technical Condition Factor (“DMTCF”) of the 16 Cryptocurrencies ETFs (or 7 X 16) for a possible range of 0-112 if all 16 had fulfilled the DMTCF criteria the reading would be 112 or 100%.
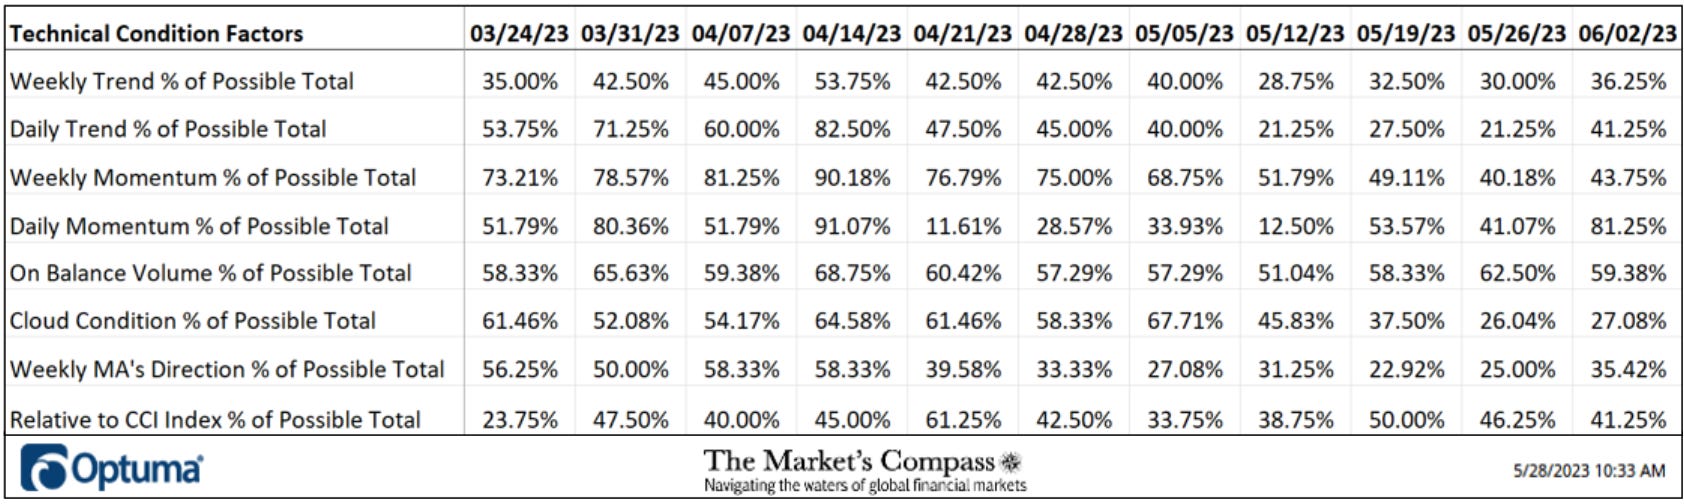
Two weeks ago, for the week ending May 26th, 46 of a possible total of 112 positive points or a 41.07% reading in the DMTCF was registered. That marked a below neutral reading . Last week the DMTCF rose sharply to 81.25%.
As a confirmation tool, if all eight TCFs improve on a week over week basis, more of the 16 Cryptocurrencies are improving internally on a technical basis, confirming a broader market move higher (think of an advance/decline calculation). Conversely, if more of the TCFs fall on a week over week basis, more of the “Cryptos” are deteriorating on a technical basis confirming the broader market move lower. Last week six TCFs rose and two fell.
The CCi30 Index with This Week’s Sweet Sixteen Total Technical Ranking “SSTTR” Overlaid
The Sweet Sixteen Total Technical Ranking (“SSTTR”) Indicator is a total of all 16 Cryptocurrency rankings and can be looked at as a confirmation/divergence indicator as well as an overbought / oversold indicator. As a confirmation/divergence tool: If the broader market as measured by the CCi30 Index continues to rally without a commensurate move or higher move in the SSTTR the continued rally in the CCi30 Index becomes increasingly in jeopardy. Conversely, if the CCi30 Index continues to print lower lows and there is little change or a building improvement in the SSTTR a positive divergence is registered. This is, in a fashion, is like a traditional A/D Line. As an overbought/oversold indicator: The closer the SSTTR gets to the 800 level (all 16 Cryptocurrencies having a TR of 50) “things can’t get much better technically” and a growing number individual Crypto’s have become “stretched” there is more of a chance of a pullback in the CCi30. On the flip side the closer to an extreme low “things can’t get much worse technically” and a growing number of Crypto’s are “washed out technically” and an oversold rally or measurable low is closer to being in place. The 13-week moving average in Red smooths the volatile SSTTR readings and analytically is a better indicator of trend.
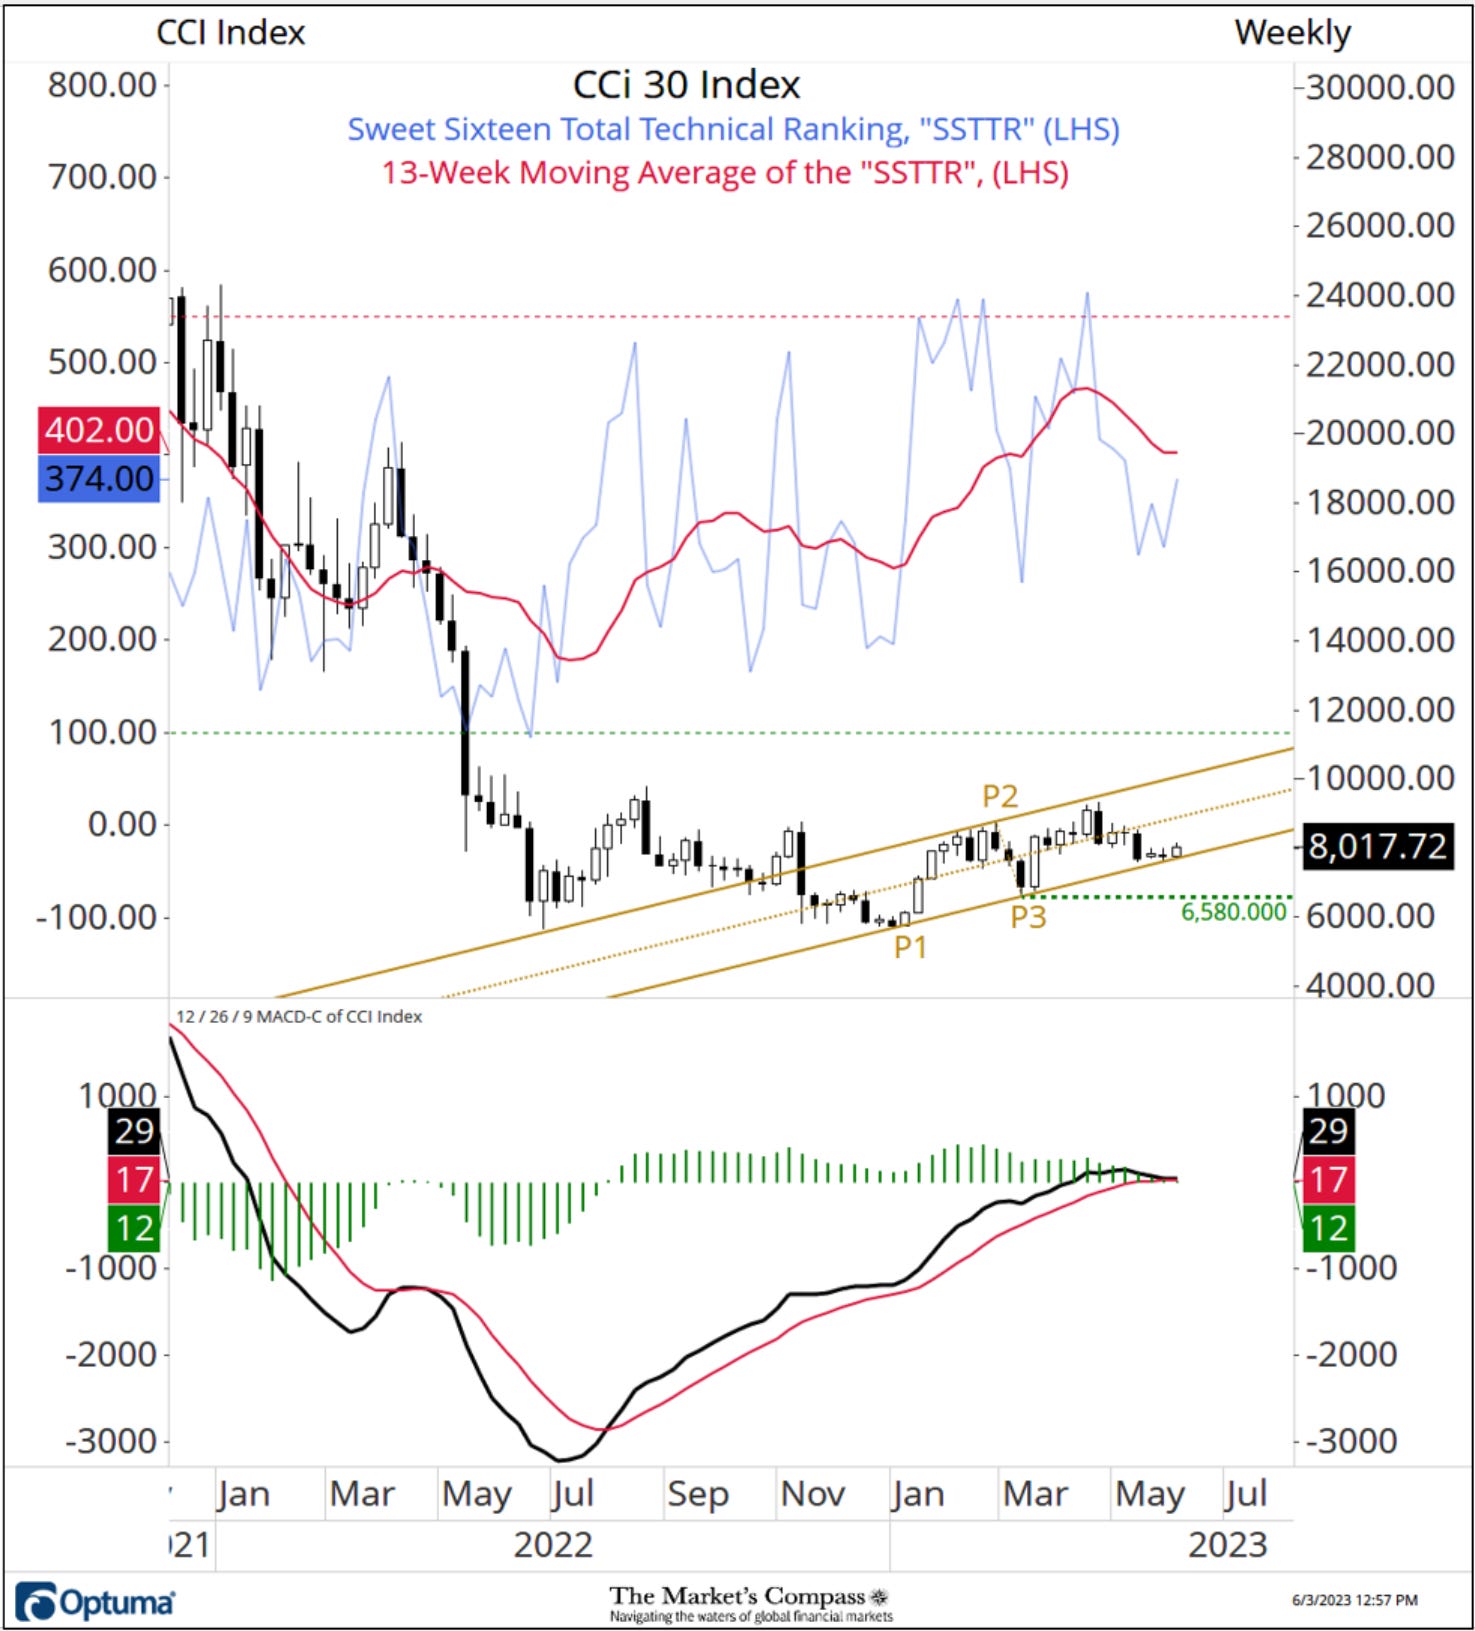
Last week the SSTTR rose to 374 (remaining in neutral territory) and the 13-Week Moving Average (red line) has begun to flatten out. At the end of last week the CCi30 Index had continued to hold support just above the Lower Parallel (solid gold line) of the Schiff Modified Pitchfork (gold P1 through P3). MACD has held above its signal line in neutral territory (neither overbought or oversold). A violation of the Lower Parallel would put second price support at P3 (6,580) into play.
The CCi30 Index Weekly Cloud Model with the Average Sweet Sixteen Technical Ranking (ASSTR)*
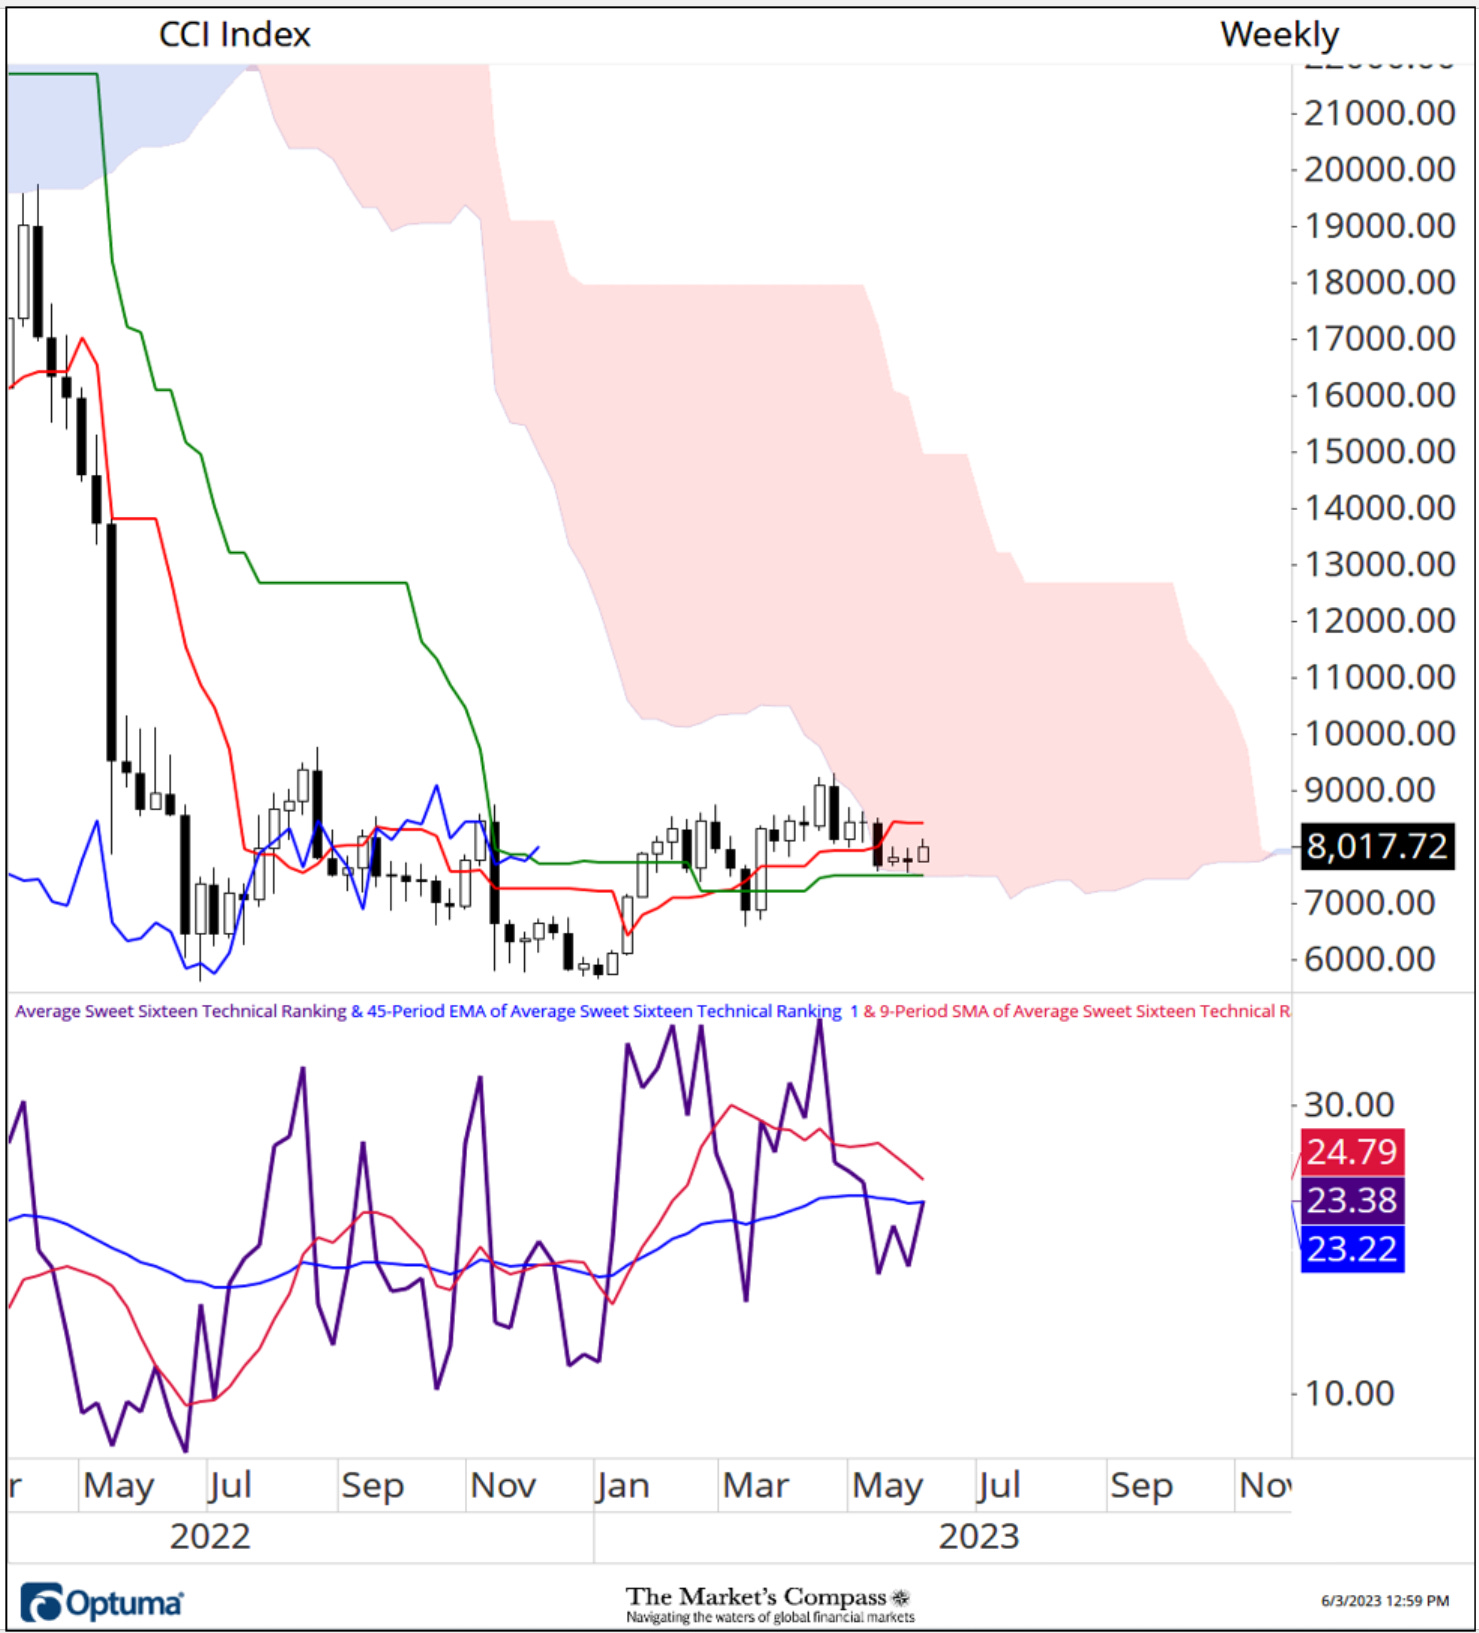
*The Average Sweet Sixteen Technical Ranking is the average individual TR of the sixteen cryptocurrencies we track at the end of each week.
The CCi30 Index has held support at the Kijun Plot (green line) since retaking the ground above it in March. The Average Sweet Sixteen Technical Ranking has risen from a higher low of 18.78, registered two weeks ago, to 23.38. I continue to believe that the price action at the Index level is part of a base building process and barring a break of price support at the March 10th price pivot low at 6,580 that the Index will challenge price resistance at June/July 2022 highs at the 10,000 /11,000 level in the weeks ahead.
Charts are courtesy of Optuma whose charting software enables anyone to visualize any data including our Objective Technical Rankings. Cryptocurrency price data is courtesy of Cryptowatch.
To receive a 30-day trial of Optuma charting software go to…
A three part tutorial series on Andrews Pitchfork may be read at my web site…. www.themarketscompass.com
Source link
#Markets #Compass #Crypto #Sweet #Sixteen #Study