
Welcome to this week’s publication of the Market’s Compass Developed Markets Country (DMC) ETF Study #454. It continues to highlight the technical changes of the 22 DMC ETFs that we track on a weekly basis and share our technical opinion on, every three weeks. There are three ETF Studies that include the Market’s Compass US Index and Sector (USIS) ETF Study, the Developed Markets Country (DMC) ETF Study and the Emerging Markets Country (EMC) ETF Study. The three Studies will individually be published every three weeks and sent to paid subscriber’s email. There is now a Weekly publication that is sent to paid subscribers every Sunday titled The Market’s Compass Crypto Sweet Sixteen Study that tracks the technical condition of sixteen of the larger cap Cryptocurrencies that also uses (similar to the ETF Studies) an objective technical ranking model among other measures including relative strength and my preferred technical analysis tools.
This Week’s and 8 Week Trailing Technical Rankings of the 22 Individual ETFs
The Excel spreadsheet below indicates the weekly change in the objective Technical Ranking (“TR”) of each individual ETF. The technical ranking or scoring system is an entirely quantitative approach that utilizes multiple technical considerations that include but are not limited to trend, momentum, measurements of accumulation/distribution and relative strength. If an individual ETFs technical condition improves the Technical Ranking (“TR”) rises and conversely if the technical condition continues to deteriorate the “TR” falls. The “TR” of each individual ETF ranges from 0 to 50. The primary take-away from this spread sheet should be the trend of the individual “TRs” either the continued improvement or deterioration, as well as a change in direction. Secondarily a very low ranking can signal an oversold condition and conversely a continued very high number can be viewed as an overbought condition but with due warning over sold conditions can continue at apace and overbought securities that have exhibited extraordinary momentum can easily become more overbought. A sustained trend change needs to unfold in the individual TR for it to be actionable.
On a WoW basis the Total Developed Markets ETF Ranking (“TER”) fell -49.07% to 321 from 478.5. After reaching a low of 294.5 four weeks ago the TER had risen to 478.5 two weeks ago but has turned lower again to last weeks reading.
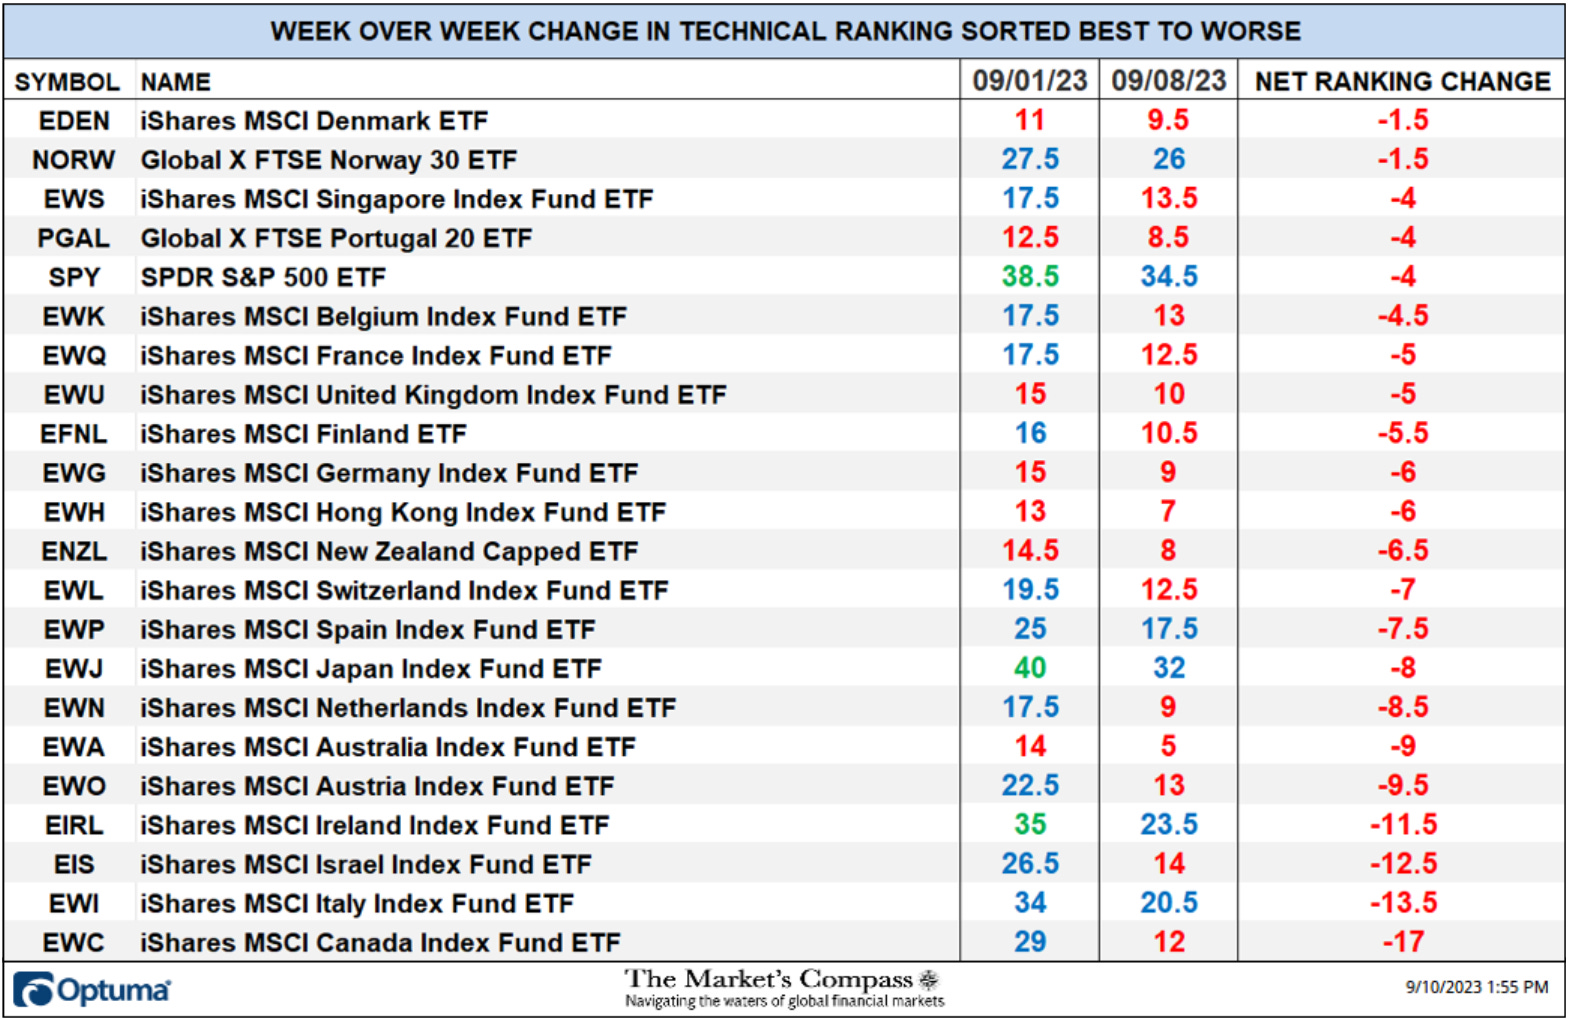
All twenty two of the Developed Market TRs we track in these page saw a drop in their TRs on a WoW basis marking an across the board technical deterioration. As can be seen above, at the end of last week there were six ETFs in the “blue zone” (15.5 to 34.5) and fourteen were in the “red zone” (0 to 15). This was versus the week before when three ETFs had TR in the “green zone” (35-50), twelve were in the “blue zone” and seven were in the “red zone”. The Average TR loss of the 22 Developed Markets Country ETFs last week was -7.15. Three of the the largest drops in TRs was regestered by the iShares MSCI Canada Index Fund ETF (EWC) which fell -17 to 12 from 29 followed by the iShares MSCI Italy Index Fund ETF (EWI) which dropped -13.5 “handles” to 20.5 from 34 and the iShares MSCI Israel Index Fund ETF (EIS) which lost -12.5 points to 14 from 26.5.
The Technical Condition Factor Changes over the past week and previous 8 weeks
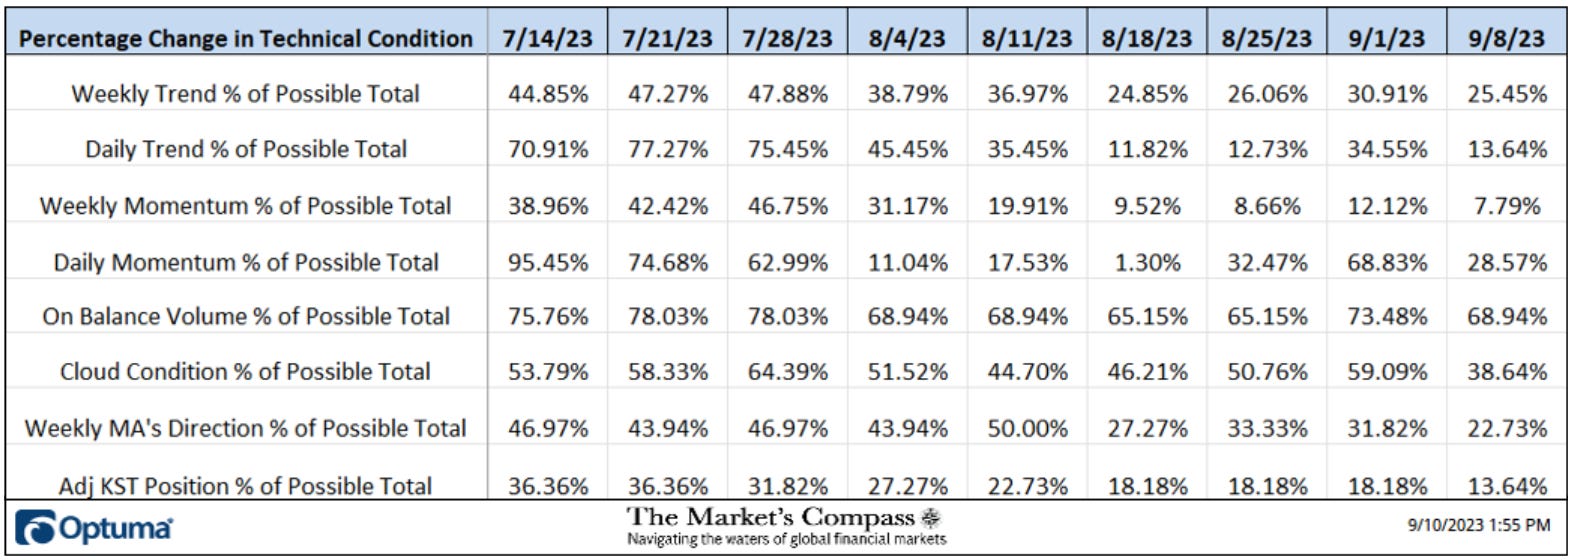
There are eight Technical Condition Factors (“TCFs”) that determine individual TR scores (0-50). Each of these 8, ask objective technical questions (see the spreadsheet posted above). If a technical question is positive an additional point is added to the individual TR. Conversely if the technical question is negative, it receives a “0”. A few TCFs carry more weight than the others such as the Weekly Trend Factor and the Weekly Momentum Factor in compiling each individual TR of each of the 22 ETFs. Because of that, the excel sheet above calculates each factor’s weekly reading as a percent of the possible total. For example, there are 7 considerations (or questions) in the Daily Momentum Technical Condition Factor (“DMTCF”) of the 22 ETFs (or 7 X 22) for a possible range of 0-154 if all 22 ETFs had fulfilled the DMTCF criteria the reading would be 154 or 100%.
A 28.57% reading in the DMTCF was registered for the week ending September 8th, or 44 of a possible total of 154 positive points. Four weeks ago a deep oversold reading of 1.30% was registered and it was the lowest level reached since the the week ending February 29th reading of 0.65%.
As a confirmation tool, if all eight TCFs improve on a week over week basis, more of the 22 ETFs are improving internally on a technical basis, confirming a broader market move higher (think of an advance/decline calculation). Conversely, if more of the 22 TCFs fall on a week over week basis, more of the ETFs are deteriorating on a technical basis confirming the broader market move lower. Last week all eight TCF fell confirming the broad technical deterioration in the 22 Developed Markets Country ETFs.
The URTH with This Week’s Total ETF Ranking “TER” Overlaid*
The Total Technical ETF Ranking (“TER”) Indicator is a total of all 22 ETF rankings and can be looked at as a confirmation/divergence indicator as well as an overbought oversold indicator. As a confirmation/divergence tool: If the broader market as measured by the iShares MSCI World Index ETF (URTH) continues to rally without a commensurate move or higher move in the TER the continued rally in the URTH becomes increasingly in jeopardy. Conversely, if the URTH continues to print lower lows and there is little change or a building improvement in the TER a positive divergence is registered. This is, in a fashion, is like a traditional A/D Line. As an overbought/oversold indicator: The closer the TER gets to the 1100 level (all 22 ETFs having a TR of 50) “things can’t get much better technically” and a growing number individual ETFs have become “stretched” the more of a chance of a pullback in the URTH. On the flip side the closer to an extreme low “things can’t get much worse technically” and a growing number of ETFs are “washed out technically” an oversold rally or measurable low is close to be in place. The 13-week exponential moving average in Red smooths the volatile TER readings and analytically is a better indicator of trend.
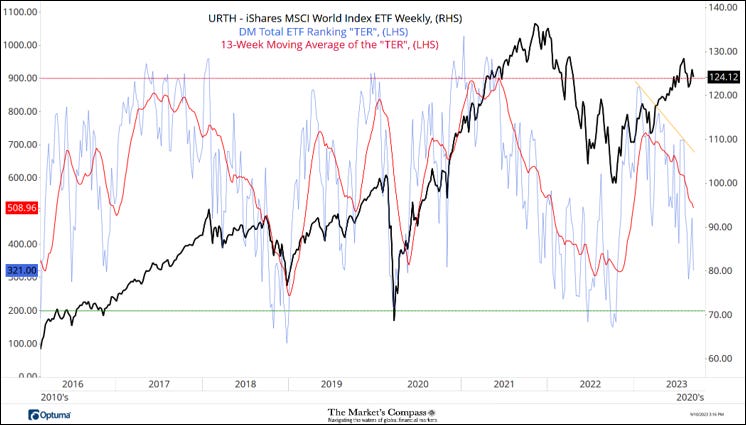
After a sharp bounce in the DM Total ETF Ranking (“TER”) two weeks ago to 478.5 the TER fell back sharply to last weeks reading to 321. That drop keeps the 13-Week Moving Average of the TER in its 7-month downtrend and leaves the non-confirmation of the late July highs in place.
The Average Technical Ranking of the 22 Developed Markets Country ETFs*
The weekly Average DM Technical Ranking (“ATR”) is the average of the individual Technical Rankings of the 22 Developed Markets Country ETFs we track. Like the TER, it is a confirmation/divergence or overbought/oversold indicator.
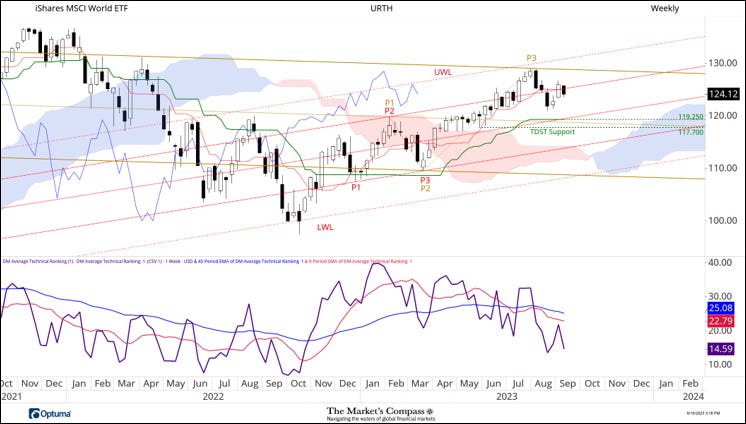
The series of lower highs in the ATR remains in place reiterating the the non-confirmation of the late July highs that was capped at the Upper Warning Line (red dashed line UWL) of the Schiff Modified Pitchfork (red P1-P3). Both the longer-term 45-Week Exponential Moving Average (blue line) and the 9-Week Simple Moving Average (red line) of the ATR continues to track lower after the failure of the shorter-term moving average to retake the ground above the longer-term moving average. Only a rally above the Upper Parallel (solid gold line) of the Standard Pitchfork (gold P1-P3) would change my bearish bias.
More on my thoughts of the short-term technical condition of the URTH later in the Blog, but first…
The Weekly Absolute and Relative Price % Change*
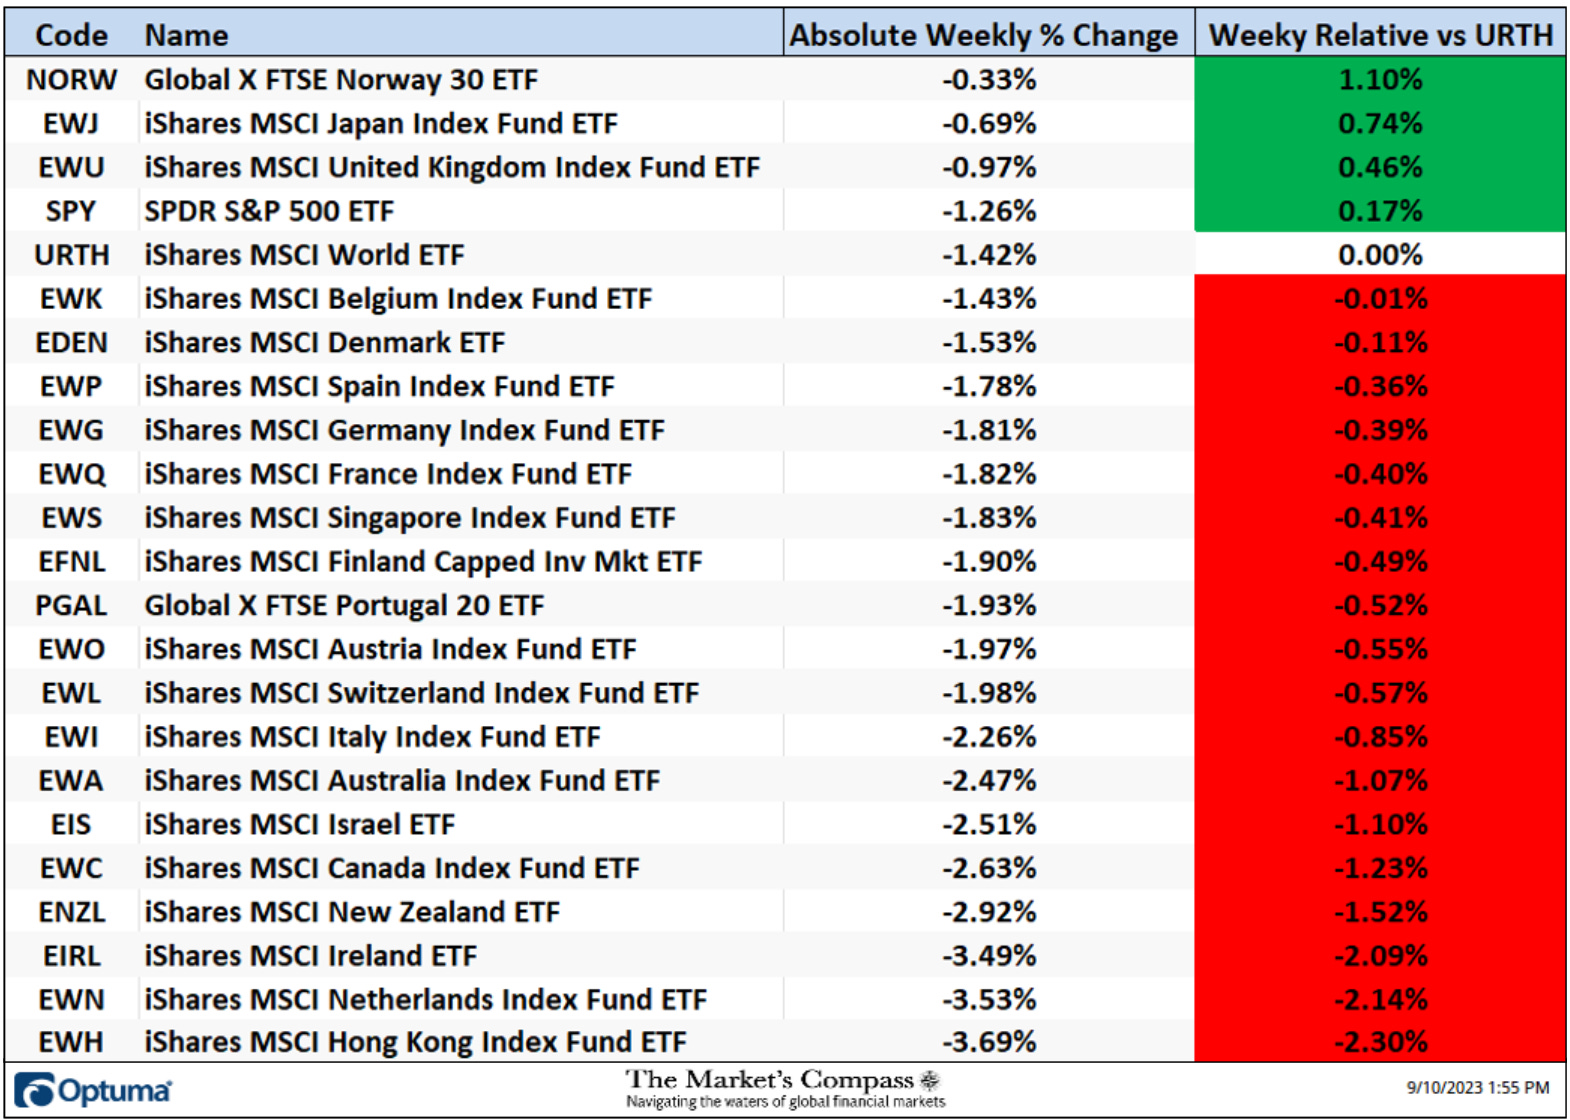
*Does not include dividends
All 22 of the Developed Markets Country ETFs we track in these pages were down on an absolute basis last week. The average absolute loss of all 22 ETFs was -2.0% versus a -1.42% loss in the URTH. Only four ETFs outperformed the iShares MSCI World Index and eighteen ETFs underperformed on a relative basis. The largest WoW absolute loss was registered by the iShares MSCI Hong Kong Index Fund ETF (EWH) which fell -3.69%.
Thoughts on the short-term technical condition of the URTH*
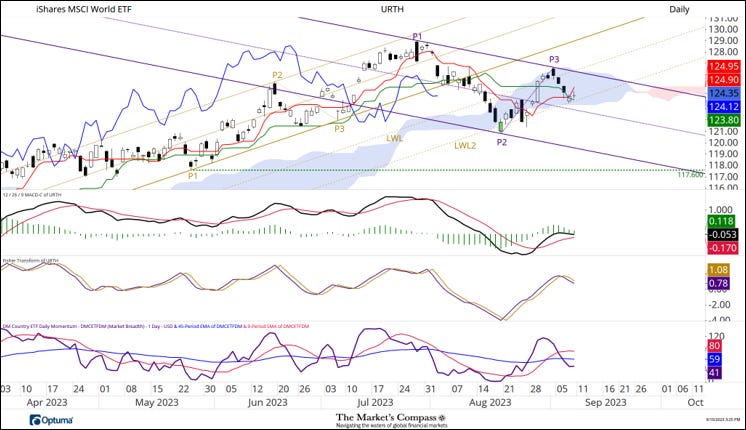
*Of interest to scalpers, traders, and technicians
When we last published the Developed Markets Country ETF Study for the week ending August 18th (green highlighted candle) the URTH had broken below Cloud support and had reached a deeply oversold condition as witnessed by the DM Country ETF Daily Momentum / Breadth Oscillator and a recovery rally developed. This was in concert with a turn in the Fisher Transform and followed by MACD overtaking its signal line. Prices found a measure of support at the Second Lower Warning Line (gold dashed line LWL2) of the longer term Schiff Modified Pitchfork (gold P1-P3) and the rally extended to the top of the Cloud before reversing course. That price reversal gave birth to the new shorter term Schiff Modified Pitchfork (Purple P1-P3). The four session pullback found support once again at the Second Warning Line last Thursday stemming the decline before the URTH broke Cloud support and the Median Line (purple dashed line) of the newer Schiff Modified Pitchfork. Only a rally through the Upper Parallel (solid purple line) and move out and above the Cloud model would suggest something more bullish was developing.
Relative Return vs. The URTH Since January 1st 2023*
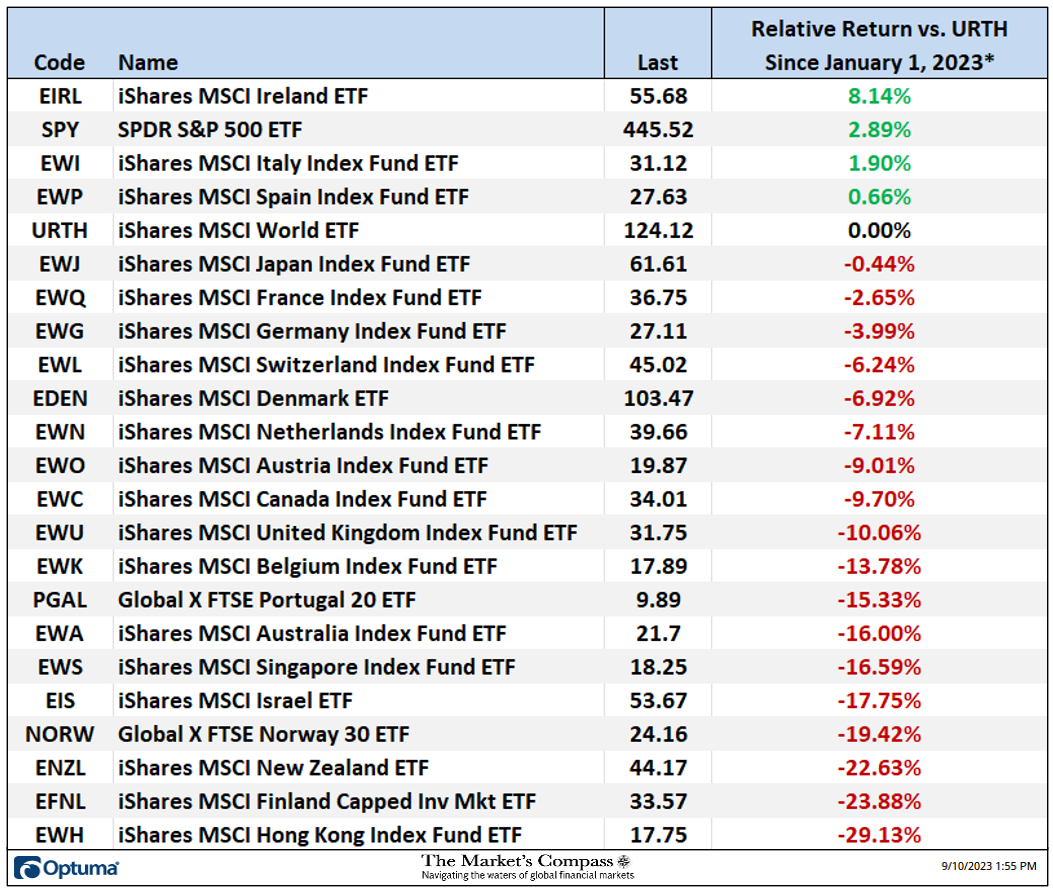
*Does not including dividends
Charts are courtesy of Optuma. Any timeseries data can be imported, charted, and tested in Optuma.
To receive a 30-day trial of Optuma charting software go to…
A three part tutorial series on Andrews Pitchfork may be read at my web site…. www.themarketscompass.com
Source link
#Markets #Compass #Developed #Markets #Country #ETF #Study