You can still run with the stock market’s bulls, but watch the exits

The stock market, as measured by the S&P 500 Index
SPX,
-0.64%

), has been moving upward. The U.S. benchmark index is essentially crawling up the higher “modified Bollinger Bands” (mBB), which is a bit of an overbought condition, but not a sell signal.

The next major resistance appears to be in the 4650 area, which at one time seemed far away but is now within range. There is minor support at 4527 (last week’s lows), with stronger support below that, at 4440, 4385, 4330 and 4200. Given the strong upward momentum of the market, a couple of those could be violated without giving the bull market any problem, but a fall below 4330 would be a game changer.

The S&P 500 has recently closed above the +4σ mBB, which sets up a “classic” sell signal. That “classic” signal was generated on Thursday when SPX closed below the +3σ Band — 4560. But we do not trade the “classic” signals, preferring to wait for the further confirmation of a McMillan Volatility Band (MVB) signal. Just because a “classic” sell signal has occurred does not mean that a MVB sell signal will automatically follow. We will keep you up to date on these developments weekly.

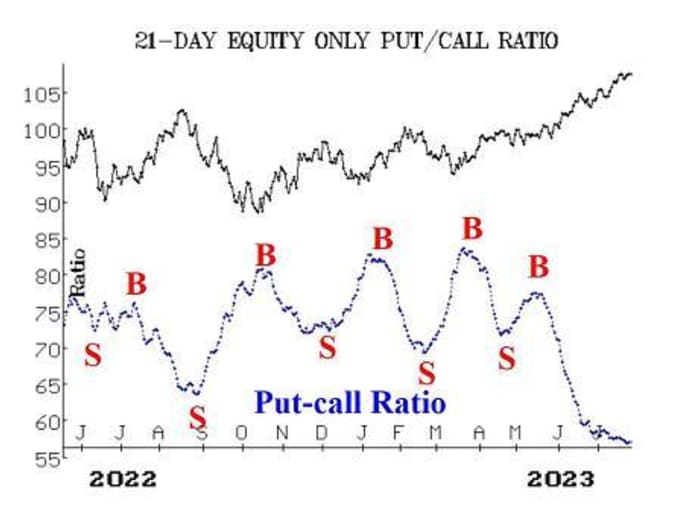
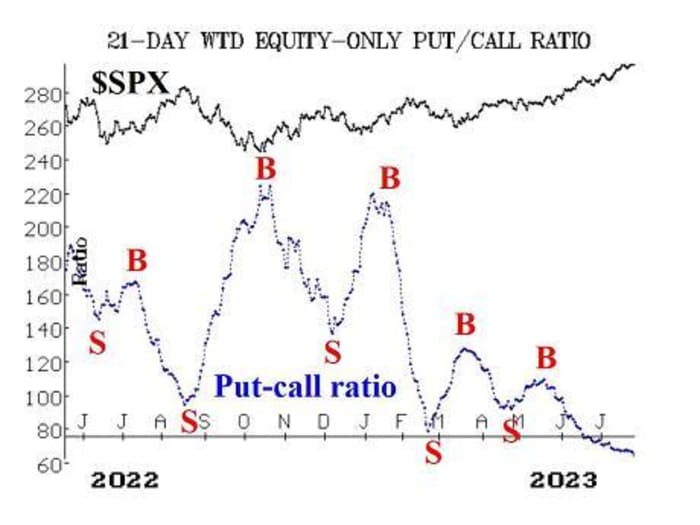
Equity-only put-call ratios have continued to edge lower as stocks have risen. This means that the put-call ratios are still on buy signals, but they are in deeply overbought territory because they are so low on their charts. The computer programs that we use to analyze these charts are once again warning of a sell signal, but we prefer to wait until we can visibly see the ratios begin to rise before taking on any negative position based on these ratios. Despite the fact that these ratios are at lows for the last year or so, it should be noted that they were much lower all during the 2021, as that bull market was pressing forward, and eventually gave way to a bear market.

Market breadth has been generally positive. Both breadth oscillators are on buy signals and are in overbought territory. They could withstand a day or two of negative breadth and still remain on those buy signals. Perhaps more importantly, cumulative volume breadth (CVB) is approaching what could be a major buy signal. If CVB makes a new all-time high, then SPX will follow. CVB is within just a small distance of its all-time high and could attain that today. Doing so would mean that an upside target of 4800+ would be in force for SPX.

New Highs on the NYSE continue to dominate New Lows, so this indicator remains strongly positive for stocks.

VIX
VIX,
+9.25%

is languishing between 13 and 14. As long as this continues, stocks can rise. The only time problems would surface would be if VIX spurted higher. So far, that hasn’t happened. It appears that “big money” still has some fear of this market, so they are buying SPX puts, keeping VIX a bit elevated. It should also be noted that VIX normally makes its annual low in July and begins to rise in August. So that is a potentially negative seasonal factor on the horizon.

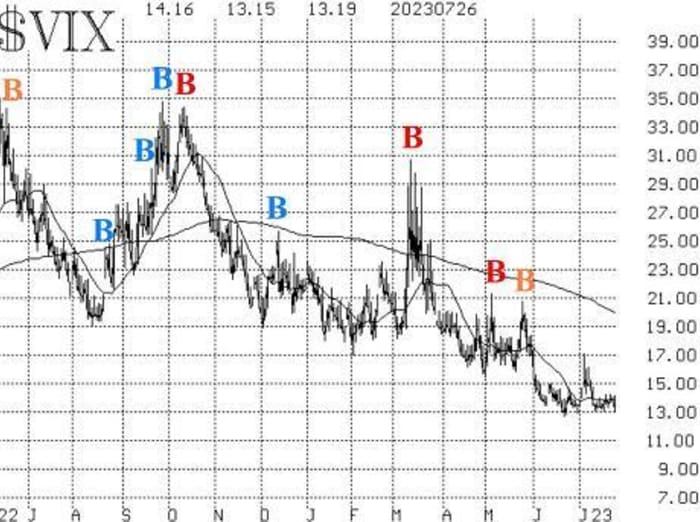
The construct of volatility derivatives remains bullish for stocks, since the term structures of both the VIX futures and of the CBOE Volatility Indices continue to slope upwards.

Overall, we are maintaining our “core” bullish position because of the bullish SPX chart. We are raising trailing stops and rolling deeply in-the-money calls upward as we go along. Eventually, we will trade other confirmed signals around that “core” position.

New recommendation: Potential CVB buy signal

We made this recommendation last week and recommended using the cumulative total of daily NYSE advancing volume minus declining volume as a guide. That cumulative total did reach our projected value as of July 26. In reality, the “stocks only” CVB ended just shy of a new all-time high. We are going ahead with the recommendation, since the way that we stated it last week did generate the buy signal.

Buy 4 SPY Sept (29th) 480 calls: Since CVB reached a new all-time high, we are going to buy SPY
SPY,
-0.66%

calls with a striking price equal to SPY’s all-time high. We will hold without a stop initially.

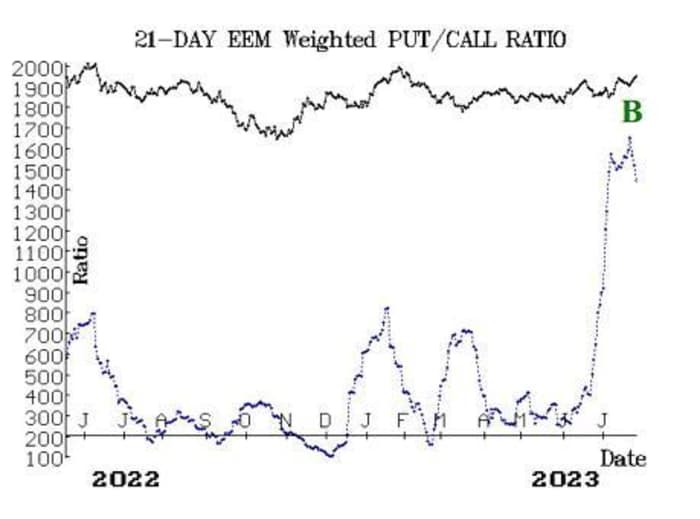
New Recommendation: Emerging markets ETF (EEM)

There has been a high-level buy signal generated from the weighted put-call ratio for the Emerging Markets ETF
EEM,
-1.23%
.
Put buying has been extremely strong for more than a month and is now is abating. This has generated the buy signal.

Buy 5 EEM Oct (20th) 41 calls in line with the market

We will hold these calls as long as the EEM weighted put-call ratio remains on a buy signal.

Follow-up action: 

We are using a “standard” rolling procedure for our SPY spreads: in any vertical bull or bear spread, if the underlying hits the short strike, then roll the entire spread. That would be roll up in the case of a call bull spread, or roll down in the case of a bear put spread. Stay in the same expiration and keep the distance between the strikes the same unless otherwise instructed. 

Long 800 KOPN: 
KOPN,
-4.76%

The stop remains at 1.70.

Long 2 SPY Aug (4th) 453 calls: This is our “core” bullish position. The calls have been rolled up three times. Stop out of this trade if SPX closes below 4330. Roll up every time your long SPY option is at least 6 points in-the-money.

Long 1 SPY Aug (4th) 453 call: Bought in line with the “New Highs vs. New Lows” buy signal. The calls have been rolled up three times. Stop out of this trade if, on the NYSE, New Lows outnumber New Highs for two consecutive days. Roll up every time your long SPY option is at least 6 points in-the-money.

Long 2 PFG Aug (18th) 80 calls: This position has been was rolled up twice. We will hold this PFG
PFG,
-1.07%

position as long as the weighted put-call ratio remains on a buy signal.

Long 10 VTRS
VTRS,
-1.43%

August (18th) 10 calls: The stop remains at 10.15. 

Long 5 CCL
CCL,
+3.23%

Aug (18th) 17 calls: Raise the stop to 17.10.

Long 2 PRU
PRU,
-0.46%

Aug (18th) 87.5 calls: We will continue to hold these calls as long as the weighted put-call ratio remains on a buy signal.

Long 8 CRON
CRON,
-1.66%

Aug (18th) 2 calls: Hold these calls without a stop while takeover rumors play out.

Long 6 ORIC
ORIC,
-9.06%

Aug (18th) 7.5 calls: The stop remains at 7.40.

Long 2 EW
EW,
-9.78%

Aug (18th) 95 puts: Continue to hold these puts as long as the weighted put-call ratio remains on a sell signal.

All stops are mental closing stops unless otherwise noted.

Lawrence G. McMillan is president of McMillan Analysis, a registered investment and commodity trading advisor. McMillan may hold positions in securities recommended in this report, both personally and in client accounts. He is an experienced trader and money manager and is the author of the best-selling book, Options as a Strategic Investment. www.optionstrategist.com

©McMillan Analysis Corporation is registered with the SEC as an investment advisor and with the CFTC as a commodity trading advisor. The information in this newsletter has been carefully compiled from sources believed to be reliable, but accuracy and completeness are not guaranteed. The officers or directors of McMillan Analysis Corporation, or accounts managed by such persons may have positions in the securities recommended in the advisory. 

Source link

#run #stock #markets #bulls #watch #exits

Ongoing Sector Rotation Out Of Defense Into Technology

The Relative Rotation Graph for US sectors continues to show a shift out of defensive sectors into more offensive and economically sensitive ones.

The improvement for XLC (communication services, XLY (consumer discretionary), and XLK (technology) continues and is visible inside the improving quadrant. All three tails are travelling at a positive RRG-Heading. XLC and XLK are coming very close to crossing over into the leading quadrant, while XLY is still the sector with the lowest RS-Ratio reading but rapidly picking up now.

Communication Services

XLC managed to break away from its falling trend channel at the end of last year. Since then, a double bottom formation was completed, out of which a rally followed that brought the sector back to resistance near 60. The decline that followed after setting a peak against that resistance level is the first serious pull-back after breaking away from the bottoming formation.

On the back of that improvement in price, the relative strength for XLC against SPY has rapidly improved, and the tail on the RRG is now close to crossing over into the leading quadrant. Overall, the current setback seems to offer a good new entry point, especially when the tail on the daily RRG will rotate back into a positive RRG-Heading. Confirmation will be given when XLC can take out resistance at 60.

Technology

After breaking above its falling resistance and out of the declining channel, XLK is managing to hold up well above its previous high, now acting as support. This confirms that a new series of higher highs and higher lows is now in place.

Relative strength against SPY has just broken above its previous high, signalling an end to the relative downtrend as well.

On the RRG, the tail for XLK is inside improving, travelling at a strong RRG-Heading and ready to cross over into the leading quadrant.

Even if XLK dropped back below support between roughly 135-137, it would not immediately harmn the new trend. There is still a bit of room to manoever.

Here also, a rotation back to a positive RRG-Heading on the daily RRG tail will be the confirmation for further relative improvement over SPY.

Consumer Discretionary

The break above the falling resistance line marked the end of the downtrend that started at the end of 2021. For the last three weeks, XLY remained above its breakout level around 147, where falling trendline resistance co-incided with the horizontal resistance offered by the most recent peaks in H2-2022. This in itself is a sign of strength.

Combine this with a further improvement in relative strength and the weekly tail moving further into the improving quadrant, and things are looking good for XLY. The only things that makes XLY a bit more risky than XLK and XLC is the fact that it has the lowest Jdk RS-Ratio reading on the weekly RRG. This means there is still some risk for this tail to roll over while inside improving and not making it all the way to leading.

Just like for XLC and XLK, here also a rotation back up on the daily RRG will provide support for a further improvement in coming weeks.


Rotation out of Defense

On the opposite side of these rotations, at a positive RRG-Heading we are still seeing money flowing out of the defensive sectors. Their tails continue to travel at a negative RRG-Heading. XLU has already crossed into the lagging quadrant. XLV and XLP are still inside weakening but rapidly moving towards lagging.

Utilities

This sector has been showing a very choppy chart since it came down off its high near 78. In that move, trendline support was broken, as well as support coming from two previous lows. The rally then tried to break back above resistance, sending some confusing messages in the process. But finally that attempt failed, and a small double top formation was completed in that resistance zone, and the market is now working its way lower from that high.

Relative strength has started to move inline and recently broke below its former low, signalling that a downtrend is now in place. This puts the tail on the weekly RRG back into the lagging quadrant while at a negative RRG-Heading, suggesting that there is more relative weakness ahead in coming weeeks.

Consumer Staples

XLP dropped out of its rising channel in the first half of 2022. Since then, a trading range has developed between 66 and 77. The last rally to this upper boundary ended in another test of resistance and a failure to break. Out of this recent high a new series of lower highs and lower lows is developing, and XLP seems to be underway to the lower end of the range again.

This sideways price performance has also caused relative weakness for this sector, resulting in the tail on the weekly RRG to move rapidly towards the lagging quadrant, currently inside weakening, at a negative RRG-Heading.

Health Care

The third and final defensive sector is Health care. This sector already started trading in a range late 2021, starting 2022. The upper boundary is marked around 140 while the lower boundary is coming in around 122.50 with two to three dips towards 117.5.

This sideways movement caused really strong relative strength during 2022, when the S&P 500 moved significantly lower. However, XLV has not been able to keep up with the recent strength in the S&P, and relative strength is now rolling over. On the weekly RRG the XLV tail is following XLP towards the lagging quadrant.

All-in-All, rotation out of defensive sectors continues, and a more pronounced move into more offensive and sensitive sectors is starting to shape up. This suggests underlying strength for the broader market.

#StayAlert, –Julius


Julius de Kempenaer
Senior Technical Analyst, StockCharts.com
CreatorRelative Rotation Graphs
FounderRRG Research
Host ofSector Spotlight

Please find my handles for social media channels under the Bio below.

Feedback, comments or questions are welcome at [email protected]. I cannot promise to respond to each and every message, but I will certainly read them and, where reasonably possible, use the feedback and comments or answer questions.

To discuss RRG with me on S.C.A.N., tag me using the handle Julius_RRG.

RRG, Relative Rotation Graphs, JdK RS-Ratio, and JdK RS-Momentum are registered trademarks of RRG Research.

Julius de Kempenaer

About the author:
Julius de Kempenaer is the creator of Relative Rotation Graphs™. This unique method to visualize relative strength within a universe of securities was first launched on Bloomberg professional services terminals in January of 2011 and was released on StockCharts.com in July of 2014.

After graduating from the Dutch Royal Military Academy, Julius served in the Dutch Air Force in multiple officer ranks. He retired from the military as a captain in 1990 to enter the financial industry as a portfolio manager for Equity & Law (now part of AXA Investment Managers).
Learn More

Subscribe to RRG Charts to be notified whenever a new post is added to this blog!

Source link

#Ongoing #Sector #Rotation #Defense #Technology

Hong Kong Eyes Becoming A Global Digital Asset Hub By Legalizing Crypto Trading: Report


Just a few days after Hong Kong reassured businesses that its stand on cryptocurrencies is separate from that of mainland China, a new report this week revealed that the vertical city is planning to legalize retail crypto trading to regain its status as a global digital asset hub.

The Hong Kong government is reportedly planning a mandatory licensing program for crypto platforms that will enable retail cryptocurrency trading, Bloomberg reported Thursday, citing unnamed sources familiar with the matter. The plan to re-establish the vertical city as a global crypto hub is expected to be revealed Monday at the Hong Kong FinTech Week, with the plans said to be enforced in March 2023.

Elizabeth Wong, the director of licensing and head of the fintech unit of Hong Kong’s Securities and Futures Commission (SFC), confirmed last week that they are considering allowing retail investors to “directly invest into virtual assets.”

“We’ve had four years of experience in regulating this industry … We think that this may be actually a good time to really think carefully about whether we will continue with this professional investor-only requirement,” she was quoted as saying by South China Morning Post, noting that the industry has also become more compliant.

The SFC director’s comment comes as the Hong Kong government boosts efforts to bring back entire fintech businesses that have left the city. A few years ago, the city used to be a leading global center for cryptocurrency companies like FTX, Binance, Amber Group and Q9 Capital.

However, in 2021, Hong Kong launched a licensing regime that shut down cryptocurrency exchange platforms to everyone except professional investors with portfolios of at least $1.03 million. If the said plan of legalizing retail trading pushes through, it would underline a major shift in the stand of the SFC about crypto.

However, some think that Hong Kong’s plan could be just China’s way to use it as a proxy to transact crypto. Former BitMEX CEO Arthur Hayes in his latest blog said that China just wanted to recycle its surplus dollars and reduce its USD balance without disrupting its financial system, so it has to use Hong Kong.

“If there is a governmental belief that crypto and the technological revolution it heralds have value, then having a vibrant crypto ecosystem in an adjacent territory is a sound policy. Beijing never has to allow the aspects of crypto that might be socially destabilizing to its political model across the border. Hong Kong can be used as a safe space for Beijing to experiment with the crypto capital markets,” Hayes said.

“China has not left crypto — it has just been dormant. The current global geopolitical situation will force China to do something with its dollars. I believe that the reorientation of Hong Kong as a pro-crypto location is a prong in Beijing’s strategy to reduce its position in a way that won’t destabilize its internal financial system,” he added.

Related Articles


Source link